Wednesday, April 19, 2017

Troubleshooting Netfilter

I'm developing a Linux "Diverter" to handle packets for FakeNet-NG, and I've run into some mind-bending issues. Here is a fun one.

I needed to make FakeNet-NG respond when clients use it as their gateway to talk to arbitrary IP addresses. This is done easily enough: 

iptables -t nat -I PREROUTING -j REDIRECT

At the same time, I needed to make it possible for clients asking for arbitrary ports (where no service was bound), to be redirected to a dummy service. And I needed to write pcaps, produce logging, and allow other on-the-fly decisions to be made. This I did using python-netfilterqueue and dpkt to mangle port numbers on the way in, fix them on the way out, and recalculate checksums as necessary.

These solutions each worked great. But as I learned while demonstrating this functionality, they just didn't work at the same time:

root@ubuntu:/home/mykill# echo fdsa | nc -v 5.5.5.5 45678
nc: connect to 5.5.5.5 port 45678 (tcp) failed: Connection timed out

I compared pcaps from successful and unsuccessful conversations between the client system and an arbitrary IP address (say, 5.5.5.5). In successful cases (where my packet mangling code was inactive), the FakeNet system responded with whatever IP the client asked to talk to, and the two systems successfully finished the TCP three-way handshake necessary to establish a connection and exchange information. But when my packet mangling code was active, the FakeNet system responded with a SYN/ACK erroneously bearing its own IP address, and the client responded with an RST.

RST is TCP-ese for "Sit down, I wasn't even talking to you."

This behavior led me to the suspicion that my packet mangling activity was preventing the system from recognizing and fixing up response packets so that their IP addresses would match the IP address of the incoming packet (say, 5.5.5.5).

To investigate this, I started by looking at net/netfilter/xt_REDIRECT.c with the goal of learning whether the kernel was using things like the TCP port numbers I was mangling to try to keep track of what packets to fix up. I found that in the case of IPv4, redirect_tg4() calls nf_nat_redirect_ipv4() in nf_nat_redirect.c which unconditionally accesses conntrack information in the skb (short for socket buffer, i.e. the packet), finally calling nf_nat_setup_info() in nf_nat_core.c. The latter function manipulates the destination IP address and calculates a "tuple" and "inverse tuple" that will be used to identify corresponding packets by their endpoint (and other protocol characteristics) and fix up any fields that were mangled by the NAT logic.

I was surprised conntrack was involved because I hadn't needed to use the -m conntrack argument to implement redirection. To confirm what I was seeing, I used lsmod to peek at the dependencies among Netfilter modules. Sure enough, I found that xt_REDIRECT.ko (which implements the REDIRECT target in my iptables rule) relies on nf_nat.ko, which itself relies on nf_conntrack.ko.

I still didn't have the full picture, but it seemed more and more like I was on to something. Perhaps the system was calculating a "tuple" based on the TCP destination port of the incoming packet, my code was modifying the TCP destination port, and then the system was getting a whack at the response packet before I had a chance to fix up its TCP source port to something that would result in a match.

I wanted to figure out when the REDIRECT logic was executing versus when my own logic was executing so I could confirm that hypothesis. While I puzzled over this, I happened upon some relevant documentation that led me to believe I might be correct about the use of TCP ports (rather than, say, socket ownership) to track connections:

Yeah dummy. It's the port.

This documentation also answered my question of when the NAT tuple calculations occur:
Connection tracking hooks into high-priority NF_IP_LOCAL_OUT and NF_IP_PRE_ROUTING hooks, in order to see packets before they enter the system.
These chains were consistent with the registration structures in xt_REDIRECT.c, which further indicated that the hooks were specific to the nat table (naturally):

static struct xt_target redirect_tg_reg[] __read_mostly = {
 .
 .
 .
    {
        .name       = "REDIRECT",
        .family     = NFPROTO_IPV4,
        .revision   = 0,
        .table      = "nat",
        .target     = redirect_tg4,
        .checkentry = redirect_tg4_check,
        .targetsize = sizeof(struct nf_nat_ipv4_multi_range_compat),
        .hooks      = (1 << NF_INET_PRE_ROUTING) |
                      (1 << NF_INET_LOCAL_OUT),
        .me         = THIS_MODULE,
    },
};

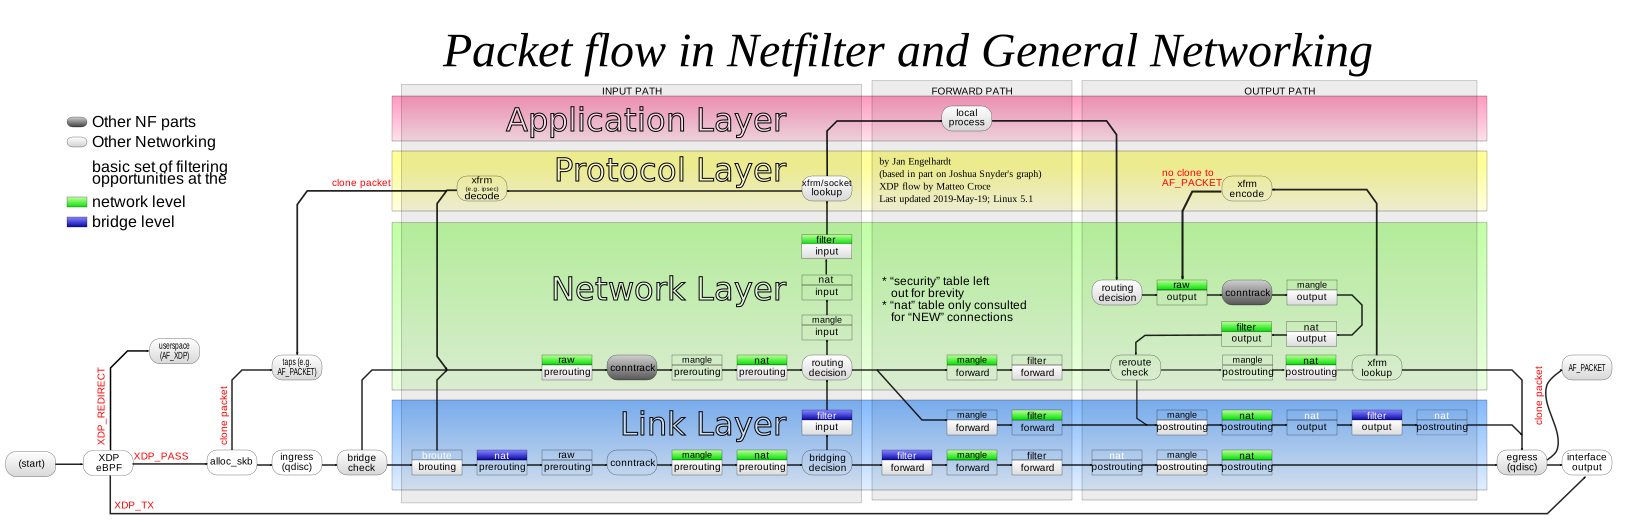
At this point, I really wanted a way to beat Netfilter's OUTPUT/nat hook to the punch. I needed to fix up the source port of the response packet and see if I could induce Netfilter to calculate correct inverse-tuples and fix up the source IPs in my response packets again. But the documentation says Netfilter implements its connection tracking using high-priority hooks in the NF_IP_LOCAL_OUT and NF_IP_PRE_ROUTING chains. That sounds a lot like Netfilter gets first dibs. I sat in uffish thought until I remembered this very detailed diagram (click to enlarge):
You are here. No, wait.

If this graphic was correct, I was about to get in before Netfilter -- by changing my fix-up hook to run in the OUTPUT/raw chain and table. I gave it a shot, and...

root@ubuntu:/home/mykill# echo asdf | nc -v 5.5.5.5 9999
Connection to 5.5.5.5 9999 port [tcp/*] succeeded!
asdf

VICTORY!

It was a hard-fought battle, but I actually was able to confirm my suspicions thanks to the very readable code in the Netfilter portion of the kernel and some very helpful documentation. It's fun to be working on Linux again!

Friday, February 3, 2017

Remember the Registers (or, the ABCs of x86)

I have a friend who is about to learn assembly language on x86. This means understanding how processor registers are used. So, I'm sharing some mnemonics for remembering the registers and their roles on x86. Maybe they will help you, too.

A register, by the way, is just a memory location that is directly (and quickly!) accessible by the processor, usually located in the processor circuitry as opposed to being accessible at a memory address (although this depends on the hardware).

Oh. Okay, so not one of these. Got it.


I'll completely omit floating point (and MMX/SSE) stuff, but I'll briefly mention amd64 for the sake of example.

A, B, C, and D

There are four general purpose registers whose names are basically A, B, C, and D. On old 16-bit Intel processors, they were named AX, BX, CX, and DX. From each of these, you could also access the low eight bits (e.g. AL, as in "A low") and the high eight bits (e.g. AH, as in "A high"), and you still can.

When 32-bit came along, they prefixed them all with an E (meaning "extended"), so now they are EAX, EBX, ECX, and EDX.

And when AMD devised their derivative amd64 architecture, they prefixed them all with an R, presumably meaning "really-friggin'-extended". So, on amd64, they are named RAX, RBX, RCX, and RDX.

The "A" register has a few special roles, but most importantly it is used to hold the return value (i.e. the result) when functions return to their callers.

The "C" register sometimes has a special role, too, that I'll describe next.

So much for A, B, C, and D.

String

Several string instructions (e.g. cmps and movs, stos, lods) have implied operands:
  • ESI = Source
  • EDI = Destination
  • ECX = Counter
  • EAX = Value to write (sometimes applicable, sometimes not)

Stack

The stack starts at a high address in memory and as things are added to it, it grows down to lower addresses. The processor keeps track with a stack pointer, and then functions can further use a "base" pointer to point to the boundary between the caller's stack (and two other pieces of data), and their own local variables.
  • ESP = Stack Pointer
  • EBP = Base Pointer

Instruction Pointer

So special that it's all alone under its own heading:
  • EIP = Instruction Pointer
This register points to the instruction that is about to be executed.

Extra Credit: Segment Registers

Remember in Windows 95 when blue screens used to report "CS:EIP = xxxxxxx"? Neither do I, let's pretend I didn't admit that. Anyway, that CS is a segment selector indicating the location of the code segment. Modern operating systems use a flat model, so they're mostly set the same.

  • CS = Code Segment
  • DS = Data Segment
  • ES = "Extra" Segment (meh)
  • SS = Stack Segment
  • FS & GS = Even more extra segments, using the letters that follow C, D, and E, namely F and G Segments
These registers are 16 bits long and contain integers called segment descriptors; the CPU reads the Global or the Local Descriptor Table (the GDT or the LDT) to find the base address and size of each memory segment indicated by those descriptors. Operating systems commonly use a "flat" model instead of a segmented model, so these may all contain the same value. Since segmentation is largely a non-issue now, the extra segment registers are sometimes used to point to interesting structures. For example: FS => Thread Environment Block (TEB) in userspace Windows 32-bit applications.

Summary

In review:

  • EAX, EBX, ECX, EDX = A, B, C, D; Note that the 'A' register holds function return values
  • ESI, EDI = Source, Destination (for string operations) - ECX may be the counter and EAX may used, too.
  • ESP, EBP = Stack Pointer, Base Pointer
  • EIP = Instruction Pointer
  • CS, DS, SS, ES, FS, GS = Code, Data, Stack, and Extra segments, followed by F and G Segments

For the authoritative reference on all of this, see the Intel processor manuals.

Happy hackin' :)

Friday, November 11, 2016

Word.

I hate the mouse, so it makes sense that I would especially hate copying and pasting from the command line. I usually just need one word of screen output to go about my business and do what I need to do, but this requires activating the control box (Alt+Space), activating the Edit menu, activating the Mark command and then dragging the cursor over the text of interest. Woe be to me if I screw up the text selection, because then I get to start all over again. And then there's when Windows doesn't respond consistently to the Alt+Space keystrokes I'm sending in order to activate the control box (yes, this happens; no, it's not human error).

I hate this so much that I wrote a pair of programs (line and word) to resolve it. Here are three examples of using them: getting all IP addresses, copying one of several paths to the clipboard, and isolating a filename in a paragraph of output.


If you invoke line or word without an argument, it will print the output with line numbers. An argument will isolate the lines or words you specify. Word accepts negative indices like Python. Line does not, because I didn't want to hog memory reading all of stdin into a buffer, though it wouldn't be hard to add, and it's not unreasonable since this is mostly for use with small buffers. Neither program accepts ranges, because I didn't have lots of time to spend.

You can get the code here: https://github.com/strictlymike/pipe-slice

Saturday, November 5, 2016

Teachers


We've moved into our new home, and I was putting away all my computing books. This time, I decided to put them in a deliberate order, starting with the books that I read as a kid and moving on through the system layers, my education, my work, and my dabbling. Each time I see these books, they retell the story of how my curiosity grew into a professional pursuit, and they remind me how happy I am that I was able to connect with such an interesting profession. They make me think of my teachers...

During the summers, I spent a lot of time at my grandmother's house. One summer, my dad brought an old Compaq portable that the army had retired, and he set it up in the play room in her basement. I recall that the monitor supported b&w, amber, and green. Naturally, I preferred green. I used this to run newps.exe (The New Print Shop - you can play it on archive.org).


Newps allowed me to create small monochrome images (probably 64x64 pixels) and store a few dozen of them to a "folder". I learned that if I scrolled through the images by holding the down arrow, they would display sequentially, which allowed me to build short animations. I used this to create my masterpiece: a hand-dithered animation of my cousin, winking. Wow.

My dad also sometimes took me to the office with him and let me play on the computer. I remember playing some sort of DOS game and accidentally winding up in the GW-BASIC interpreter. I must have broken the game, because I saw a clubs suite, little faces, greek letters, and a mess of other inscrutable data pour out onto the screen. My dad told me these were called "characters", and that programmers probably used some of those characters to write the program. This idea blew my mind - the concept that something visual, graphical, animated - was written by someone. After that, every time I came in contact with a computer, I was preoccupied with working out what my dad must have meant when he said that software could be "written".

My dad later brought home an NEC laptop with Windows 3.11, and I stared closely at the dithering that was used to produce a realistically colored eel using 256 colors. Thinking of that thick laptop with the tiny screen reminds me that my dad was the first person to tell me to RTFM. When I wanted to understand how to play Rodents' Revenge, draw with MS Paint, or use a DOS command, he told me to read the help file.


After a while, CDs became more and more common, and the games I wanted to play were not available on floppy disks. I begged my dad for a CD-ROM drive until, one day, he walked in and threw one on my bed. When I asked him to install it, he told me to do it myself, and when I asked him how, he said "read the instructions." As a 13-year-old, I felt helpless and sorry for myself for about a split second. That was the day I learned about config.sys, emm386.exe, autoexec.bat, and mscdex.exe.

And then, RTFM I did. I somehow wound up with a copy of Dan Gookin's DOS for Dummies, which introduced me to EDIT.COM, boot disks, AUTOEXEC.BAT, and CONFIG.SYS. That summer, I became addicted to reading HELP.EXE while listening to techno all night. I unnecessarily used RAM drives to "accelerate" my file access. I used the VSAFE.COM TSR to protect myself from viruses (uh, right). I hid files from my family by placing them inside of compressed volume files (*.CVF) and applying file attributes to hide them. I had nothing worth hiding, but I just wanted to be able to hide stuff. Out of ignorance or unavailability of BIOS features, I wrote a batch file that used CHOICE.COM to password protect my computer and prevent my dad from taking up space with Internet Explorer 3.0 when I was a diehard Netscape Navigator user. And of course, I used filemgr.exe to delete Net Nanny. (Holy crap, are they still in business?!)

Then when I was in high school, my dad gave me a computer that went with me to my mom's house and had Windows 3.11 on it. My friend asked if it had a modem and I said yeah, but no AOL. He decided to come over, and the minute he saw it, he connected it to the phone line, popped up Terminal, and dialed into the DEC VAX at the University of Wisconsin - Milwaukee (UWM). From there, he ran telnet and connected to jgsdos.brooktrout.com, port 5000, and it was then that I learned about Zolstead's MUD (Multi-User Dungeon). The fact that a buddy could just walk up to a computer he had never seen before and connect over a phone line to a computer and then to another computer from there, once again blew my mind.

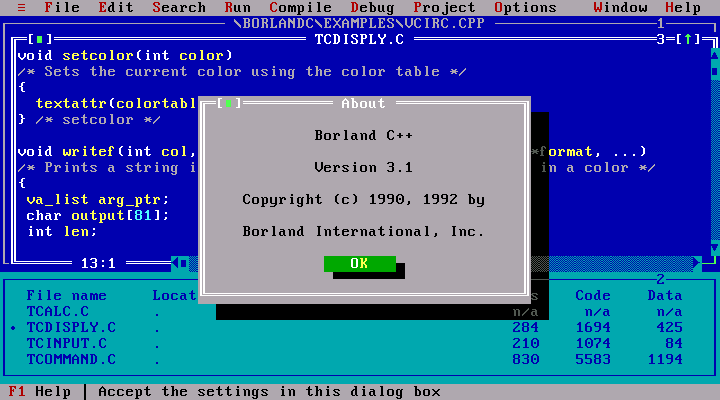
After that, it mushroomed. I found QBASIC.EXE and learned to write software. Awful software! But software, nonetheless. I started reading about C and my dad got me books about that. My friend introduced me to his buddy who, at the age of 14 or 15, seemed to already know everything about computers. While evading my girlfriend's parents, I hid at the public library and checked out an 800-page beginner's book on C++. I read the entire book before it was due back at the library and took copious notes. I was so intent on learning C++ that I wanted to buy a compiler, but Visual Studio was way too expensive, so I bought Boreland C++ 3.1, for $30.
High tech.
After that, I started looking around for where I could get more of this. I audited classes at UWM and attended two semesters of C++ courses at MSOE. When I realized that this was what college could be like, I just barely pulled out of my academic nose dive and persuaded the MSOE admissions staff that I was worth making an exception for.

I fondly remember many dozens of teachers and moments on the journey. My grandmother, who did me the incredible favor of teaching me to type. It was one of those boring basics that made everything else easier. John Carmack, who innovated video games and made me wonder about the connection between mathematics and 3D graphics. My cousin, who patiently explained, multiple times, the difference between RAM, CPU, hard disks, and floppy disks; let me use his AOL account; introduced me to GIFs; and repeatedly reminded me how to get my computer to run Gorillas.


Then there were the teachers of my professional career. Professors, University staff, and in later years, other students. My boss at my first job. The friend who saw me reading about shellcode and Linux drivers and decided to pull me into a community of hackers. The people I worked with there. And as a consultant. And as a reverse engineer.

Now, I see almost everyone I meet or know or even read about as a teacher. It's what we all are, because we're doing what we love and we want to connect other people with something we feel is very powerful. These books remind me of all the teachers I ever had. The MS DOS 5.0 user manual, Patterson & Hennesy's Computer Organization & Design, The Shellcoder's Handbook, Mastering Algorithms with C, Rootkits... My dad, my friends, my colleagues, and my co-workers.

To this day, I am trying to figure out what the sequence of events has to be to elicit and maintain a learner's interest in some discipline of study. The learners I am interested are young, old, and in-between. Here are some of my thoughts on how to engage them:
  • Get the learner past the "boring basics" that make everything else available, possible, and achievable.
  • Create opportunities for "magic moments" by exposing the learner to as many facets of our world as are available to you; when you see a "magic moment" take place, figure out how to encourage and help create more of them - gently though, because the moment you find yourself leading the horse to water, you will be disappointed to find that it is no longer thirsty.
  • Never let yourself get in the way of a learning opportunity. When you are asked to facilitate an obsession, provide the materials and let the learner do the work.
  • When we are willing to invest precious resources (time, education, or equipment), we show that we take the learner's studies seriously, and the learner has an opportunity to take themselves and their studies more seriously as well, which can lead to more focus and more courage.
  • Always be open to explaining how things work.
Maybe if I'm lucky, I will think of more things to add to this list.

Sunday, October 23, 2016

The case for reinventing the wheel

I really like to use IDA Pro as my debugger, and shellcode is no exception. Initially I couldn't see why anyone would ever write their own loader for analyzing shellcode. Siko et al released shellcode_launcher.exe along with the Practical Malware Analysis labs, so why rewrite that code? shellcode_launcher.exe does the work of ReadFile / VirtualAlloc / VirtualProtect, et cetera, so I just make that my database and pull in the VirtualAlloc'd memory using IDA Pro's memory snapshot facilities. Then, I go to town.

Well, I changed my tune when I discovered that VirtualAlloc was not receptive to my suggestions for where to allocate memory. (WinDbg: bp <callsite>; g; ed esp <lpAddress>; p). Without a consistent shellcode base address, none of my annotations from the IDA memory snapshot I took were lining up with the actual shellcode in subsequent debug sessions.

Edit January 14th, 2018: At this point, we have a choose-your-own-adventure on our hands:

  • If you use remote debugging, and/or you like to see IDA Pro annotations superimposed over your debugger session, and your shellcode itself allocates additional memory and executes code there, then you might be better off reading my fireeye.com blog article titled Debugging Complex Malware that Executes Code on the Heap.
  • If you don't use remote debugging, then you might be satisfied capturing snapshots of your debugging VM at critical points in the debug session so you can iteratively debug and understand the shellcode.
  • Finally, if your shellcode does not execute additional code on the heap and you just want to give it a uniform memory map in which to iteratively debug it, then read on...
For simple cases, you can reinvent the wheel and write your own shellcode loader to force shellcode to live at the same virtual address each time you debug it. But no need to start from scratch; here's the path of least resistance...

Assuming you have the shellcode as a raw binary, use xxd's feature of outputting shellcode as a C include file:

xxd -i myshellcode > myshellcode.c

That gives you a hexdump in C form:

unsigned char myshellcode[] = {
    0x55, 0x8b, 0xec, 0x01, 0x23, 0x45, 0x67, 0x89, 0xab, 0xcd, 0xef, 0x01,
    0x01, 0x23, 0x45, 0x67, 0x89, 0xab, 0xcd, 0xef, 0x01, 0x23, 0x45, 0x67,
    ...
    0x01, 0x23, 0x45, 0x67, 0x89, 0xab, 0xcd, 0xef, 0x01, 0x23, 0x45, 0x67,
};
unsigned int myshellcode_len = 4242;

So now, write your loader:

#include "myshellcode.c"

typedef void (*fptr)(void);

int
main(void)
{
    fptr sc = (fptr) myshellcode;
    __asm int 3 ; Safety - so I don't execute this on my analysis box (or worse!)
    sc();
}

Then do this (in an SDK prompt):

cl.exe loader.c

If you don't have Visual Studio, just get Microsoft's compiler for Python 2.7.

After compiling and linking, you'll get this:


I was worried about execute permissions when calling into my shellcode, but happily, it Just Works, perhaps because I ran cl.exe directly without using Visual Studio to specify its usual flags. The program loads in IDA as a PE-COFF, it can be debugged using IDA's debugging plugins, and the shellcode is always at the same address (in my case, unk_40A000). Therefore, you can annotate the shellcode without using the IDA Pro memory snapshot facilities to save it from a debugger session, and (this is the important part) without worrying that VirtualAlloc will return a different address during the next debug session, rendering your annotations less useful to you. The same applies to breakpoints: they will actually work, from session to session. That makes life easier.

Thursday, October 20, 2016

This one weird trick for decoding DLL malware strings

TL;DR: argtracker and ctypes. It's the ctypes part that surprised me. Read on to see why.

This procedure can make light work of decoding strings in a DLL that has a horrifying string decoder or contains a metric ton of strings. The first stage leans on code that's already out there, with a bit of duct tape to get to the second stage; the second stage is to load your malware and call into it. There's just one stick-in-the-mud limitation: it has to be a file you can load into your address space using LoadLibrary, such as a DLL. Otherwise, you have to use a different kind of tool (I'll discuss this later).

First of all, gather all the strings you want to decode. Jay Smith wrote a very cool tool for this that uses Vivisect to emulate code and locate arguments. It's called argtracker. Don't duplicate it like I was starting to do with idaapi. Please, for the love of all that is lazy, just download it and get it installed.

The IDA Python script below is basically the code from the FireEye blog with a second function added to print all the encoded strings out so you can feed them to the second stage of this procedure. If your strings aren't printable prior to decoding, then you'll need to change this up a bit.

import vivisect
import flare.argtracker as c_argtracker
import flare.jayutils as c_jayutils

# Obtain the address where each argument is referenced by the decoder along
# with the offset that was referenced
def get_first_push_arg(decoder):
    ret = []
    vw = c_jayutils.loadWorkspace(c_jayutils.getInputFilePath())
    tracker = c_argtracker.ArgTracker(vw)
    xrefs = idautils.CodeRefsTo(decoder, 1)
    for xref in xrefs:
        argslist = tracker.getPushArgs(xref, 1)
        for argdict in argslist:
            va_at, offset = argdict[1]
            ret.append(argdict[1])
    return ret

# Now go get each string
def print_va_off_and_contents(pushed_args):
    print('refva, off, argcontents')
    for (va_at, offset) in pushed_args:
        print(hex(va_at) + ', ' + hex(offset) + ', ' + GetString(offset, -1, 0))
        # https://www.hex-rays.com/products/ida/support/idadoc/283.shtml
        # 0 <= ASCSTR_C
        # 3 <= ASCSTR_UNICODE

Provide your decoder's virtual address to get_first_push_arg, and then supply the returned list to print_va_off_and_contents to get something you can massage into shape for the second stage. Yes, I know, I'm using print instead of Python's logging module. The title of this blog was actually going to have the word "lazy" in it. Maybe it still should. Anyway...

Second and final step: load the malware and call its decoder. The interesting thing I learned is that Python ctypes can call non-exported functions. What a happy surprise! First, you have to define a function prototype, then you obtain a callable by hooking that prototype to an address in your binary where the function lives. There are prototypes for stdcall (WINFUNCTYPE) and cdecl (CFUNCTYPE). We're using stdcall. Here's a convenient snippet along with the string decoding goodness.

from ctypes import *

# Modify all this
offset = 0x4321                             # Decoder offset in your mal DLL
strings = [                                 # Populate from stage 1 (above)
    [0x10001234, "ABCdef"],
    [0x10005678, "ZYX990"],
    ...
]
dll = cdll.my_malware_dll                   # Modify to load your DLL
prototype = WINFUNCTYPE(c_char_p, c_char_p) # Stdcall, accepts & returns char*

# Leave this alone
string_decoder_addr = dll._handle + offset
decode = prototype(string_decoder_addr);

for (va, s) in strings:
    print(hex(va) + ' ' + s + ' -> ' + decode(s))

Simple, dimple. Paste the strings from IDA Pro into this script, ctypes loads and calls into the malware, and Bob's your uncle. For extra credit, you can update this script to emit another script that will create the appropriate comments or bookmarks in IDA Pro. This ctypes procedure works great for DLLs. Unfortunately, next time, it'll probably be an EXE and not a DLL. For those cases, you'll have to adapt this to a different tool, such as flare-dbg, to control malware execution and feed it the strings you want to decode. I'll talk more about tools and techniques for this another time.

Thursday, October 13, 2016

Script Kitties Early Trick or Treat, Part 2


I promised a treat. Well, as scripts go, this will probably be like the time you went trick-or-treating as a kid and the old couple gave you three pennies and then you walked down the street and realized the pennies seemed to smell bad, but hey, it's money you didn't have before, so what the hay. It's not quite that bad, it's just I wrote it in 2006 and I didn't do much to bring it into modern times. But, here we go...

In 2006, PowerShell was just about to be released and around the same time I was thinking, darn it, wouldn't it be easier to experiment with VBScript if they had given me a command line? So I made one.

As it turns out, some malware is written in VBScript, so this came in handy a while back for me to decode a few lazily "encoded" strings that were assembled using the VBScript Chr() function and string concatenation. It let me figure out what COM objects were being created and move on with my life, so maybe it'll be useful to you.

I also added the ability to switch to JScript, because people also write malware in JScript, so hell, why not.

Here's a little demo:

You're wishing I just gave you the pennies now, aren't you.

Yeah, that's it. If you look at the code, you'll find out why it stinks just like those pennies. But it serves its purpose. So, enjoy!

Here's the code: https://github.com/strictlymike/eval-hta