Showing posts with label c. Show all posts

Sunday, April 23, 2017

Truthful ProgrammEEng

In this article I'll share how to approach complex logic problems by borrowing from the Electrical Engineering (EE) discipline. I'll discuss how I've used techniques from digital logic circuit design to write efficient and accurate code for hypervisor startup and for packet redirection.

This approach can reduce unnecessary nested/multiple conditional statements down to a one-liner. It applies to software engineering scenarios when you can express your problem in terms of a set of strictly Boolean (true/false) conditions.

If you find yourself contemplating a tangled web of conditional (if/else) code or you find it difficult to understand what conditions contribute to the decision you want your software to make, take a step back and consider applying this technique from digital logic circuit design. If nothing else, the first three or five steps will get you on the right track to write the correct conditional logic (in if/else style) to solve your problem. If you can carry this process to its conclusion, then you can arrive at the most optimized one-liner to solve your logic problem.

It consists of the following steps:
  1. Figure out what Boolean (true/false) conditions are necessary to the decision at hand
  2. Define a truth table that specifies all the possible conditions
  3. Mark which conditions you want to yield in a TRUE result
  4. Turn the TRUE cases (EEs call these minterms) into logical expressions
  5. Logical-OR those expressions together to render a decision (EEs call this the canonical sum-of-products, or CSOP, logic function)
  6. Simplify if possible

Here's a hypervisor programming example followed by a network filtering example to demonstrate the process.

Starting a VT-x Hypervisor


I needed to write startup code for a tiny hypervisor project using Intel Virtualization Technology Extensions (VT-x). I knew nothing about VT-x, but I did know that Intel documented the corresponding VMX instruction set and all its requirements in their processor manual, so I started there. Most of the publicly available code I could get my hands on seemed to specifically check one-off control flags to check if it was okay to enter VMX root operation, ignoring the exact specifications that Intel provided in more modern documentation. I decided to implement my own check based on the data sheet.

The Intel manual describes some requirements for control registers CR0 and CR4 to allow the VMXON instruction to work. Here is some not-very-succinct text from the Intel manual (in case this makes your eyes bleed, I'll provide a more succinct summary next):

Clear as mud.

In summary, there is a FIXED0 and a FIXED1 model-specific register (MSR) for CR0, and another pair of these for CR4. The most important part of the text above is the last sentence starting with "Thus, each bit...". This amounts to the following possible values of FIXED0:FIXED1 along with their corresponding meaning:


F0F1CR must be
00fixed to 0
11fixed to 1
01don't care

Notice that one case is missing from Intel's description: $F0:F1 = 10$. When we create a truth table including $CR$ as an input, this will amount to two missing / don't-care cases (one for $CR=0$ and another for $CR=1$).

So, expanding this out to take into account the two possible values of any bit in the control register we are checking, we have the following truth table for the possible values of $F0:F1$ and $CR$:


F0F1CRInvalid
000FALSE
001TRUE (control register bit should be 0 but is 1)
110TRUE (control register bit should be 1 but is 0)
111FALSE
010FALSE
011FALSE

Since there are two cases where a given control register bit can be in an invalid state, that means there are two logical cases, or minterms, either of which should result in a verdict of true (i.e. it is true that the control register is in an invalid state). Here's the same table from above, but formatted a little bit more like a truth table, with minterms called out.


F0F1CRInvalidMinterms
0000
0011$\overline{F0}\cdot\overline{F1}\cdot CR$
1101$F0 \cdot F1 \cdot \overline{CR}$
1110
0100
0110

This amounts to the following sum of products logic function:

$$Invalid(F0,F1,CR)=\overline{F0} \cdot \overline{F1} \cdot CR+F0 \cdot F1 \cdot \overline{CR}$$

Boolean algebra tells us that what is true for one bit in a bit vector is true for all bits. So, in C code, each negated variable (e.g. $\overline{F0}$) amounts to inverting all the bits in the integer. So, the C code for this would look like:


int is_invalid(int fixed0, int fixed1, int cr)
{
    return ((~fixed0 & ~fixed1 & cr) | (fixed0 & fixed1 & ~cr));
}

Boolean algebraic simplification can be applied to optimize this function to result in fewer logical operators, and fewer instruction opcodes emitted by the compiler. Optimization is left as an exercise for the student (hint: XOR is involved) ;-)

Redirecting Network Traffic


More recently, I've been writing logic for the Linux Diverter in FakeNet-NG. This project is the successor to the original FakeNet tool distributed by Siko and Tank to let people simulate a network in a single virtual machine. The NG version was originally developed to make it possible to use FakeNet on newer versions of Windows, but it would be nice for it to work on Linux, too.

So, I am writing a Linux "Diverter", which is a component that manages how packets are redirected and manipulated to simulate the network. This is a really fun project in which I'm using python-netfilterqueue to catch and redirect packets so we can observe traffic sent to any port in the system, even ports where no service is currently bound.

The specification for the Linux Diverter includes redirecting traffic sent to unbound ports into a single listener (similar to the INetSim dummy listener). We want the Linux version of FakeNet-NG to be used in two modes:
  • SingleHost: the malware and the network simulation tool are running on the same machine, like the legacy version of FakeNet.
  • MultiHost: the malware and the network simulation tool are running on different machines, like INetSim.
The conditions for whether a packet must be redirected boil down to a logic function of four inputs:

  • (A) Is the source address local?
  • (B) Is the destination address local?
  • (C) Is the source port bound by a FakeNet-NG listener?
  • (D) Is the destination port bound by a FakeNet-NG listener?

The criteria for changing the destination port of a packet are as follows:
  1. When using FakeNet-NG in MultiHost mode (like INetSim), if a foreign host is trying to talk to us or any other host, ensure that unbound ports get redirected to a listener.
  2. When using FakeNet-NG in SingleHost mode (like legacy FakeNet), ensure outbound destination packets are redirected except when the packet is a response from a FakeNet-NG listener (in other words, the packet originated from a bound port).
The truth table for a decision function that redirects traffic destined for local, unbound ports to a single dummy listener in both SingleHost and MultiHost scenarios is as follows, with local IPs and bound ports in bold:


Sixteen cases

Here, we translated all the different human-comprehensible conditions like "it's coming from a foreign host, don't care what port, and it's arriving at the local host to an unbound port" into a set of Boolean conditions that can be either true (1) or false (0). It's convenient to use letters like A, B, C, and D to represent the inputs (see the first row of the table above). The minterms of this function are the cases when it returns true, namely:


  1. $\overline{A} \cdot \overline{B} \cdot \overline{C} \cdot \overline{D}$
  2. $\overline{A} \cdot \overline{B} \cdot C \cdot \overline{D}$
  3. $\overline{A} \cdot B \cdot \overline{C} \cdot \overline{D}$
  4. $\overline{A} \cdot B \cdot C \cdot \overline{D}$
  5. $A \cdot \overline{B} \cdot \overline{C} \cdot \overline{D}$
  6. $A \cdot B \cdot \overline{C} \cdot \overline{D}$

We can see that a few terms can be simplified, such as (1) and (2). Since A, B, and D are false and C can be either true or false, these two really amount to A' B' D'. We can do this to arrive at a fairly simple function of these three disjunctive terms:


  • $\overline{A} \cdot \overline{B} \cdot \overline{D}$
  • $\overline{A} \cdot B \cdot \overline{D}$
  • $A \cdot \overline{C} \cdot \overline{D}$
From there, you can just get rid of B and collapse the first two cases into one:

  • $\overline{A} \cdot \overline{D}$
  • $A \cdot \overline{C} \cdot \overline{D}$
And from there, you can take one step further by looking more closely at the truth table to find the optimal logic. But there are six minterms here, so it might be time to bust out a more powerful tool: the ol' Karnaugh map. A K-map allows you to visually locate all the adjacent groups (pairs, quads, etc.) of logical "yes" outputs and arrive at the simplest possible logic function to yield the desired output. If you're not familiar, you should definitely check this out.

Here's the K-map for our logic function:


Short and sweet: two disjunctive terms in three variables

The K-map here has only two groups of adjacent minterms: those that occur when $A$ and $D$ are zero, and those that occur when $C$ and $D$ are zero. This results in two disjunctive terms, each requiring only two input variables apiece (three in total):
  • $\overline{A} \cdot \overline{D}$
  • $\overline{C} \cdot \overline{D}$
So, the minimal sum of products logic function would be:

$$R(A, B, C, D) = \overline{A}\overline{D}+\overline{C}\overline{D}$$
Or, in Python:


        return ((not src_local and not dport_bound) or
                (not sport_bound and not dport_bound))


Done and done.


The next time you find yourself rolling around in freaky nested conditionals and arriving at the wrong logic, try approaching it the way an electrical engineer would: express the problem in terms of a set of Boolean conditions and then figure out how you want each case to go. If you want the simplest result, you can use Boolean algebra or learn to use a K-map to handle the rest. But even if you stop at the truth table, at least this process will help you sort out logic that you might otherwise be confused about and ensure that you know all the test cases you'll need to include to properly test your code.

Wednesday, April 19, 2017

Troubleshooting Netfilter

I'm developing a Linux "Diverter" to handle packets for FakeNet-NG, and I've run into some mind-bending issues. Here is a fun one.

I needed to make FakeNet-NG respond when clients use it as their gateway to talk to arbitrary IP addresses. This is done easily enough: 

iptables -t nat -I PREROUTING -j REDIRECT

At the same time, I needed to make it possible for clients asking for arbitrary ports (where no service was bound), to be redirected to a dummy service. And I needed to write pcaps, produce logging, and allow other on-the-fly decisions to be made. This I did using python-netfilterqueue and dpkt to mangle port numbers on the way in, fix them on the way out, and recalculate checksums as necessary.

These solutions each worked great. But as I learned while demonstrating this functionality, they just didn't work at the same time:

root@ubuntu:/home/mykill# echo fdsa | nc -v 5.5.5.5 45678
nc: connect to 5.5.5.5 port 45678 (tcp) failed: Connection timed out

I compared pcaps from successful and unsuccessful conversations between the client system and an arbitrary IP address (say, 5.5.5.5). In successful cases (where my packet mangling code was inactive), the FakeNet system responded with whatever IP the client asked to talk to, and the two systems successfully finished the TCP three-way handshake necessary to establish a connection and exchange information. But when my packet mangling code was active, the FakeNet system responded with a SYN/ACK erroneously bearing its own IP address, and the client responded with an RST.

RST is TCP-ese for "Sit down, I wasn't even talking to you."

This behavior led me to the suspicion that my packet mangling activity was preventing the system from recognizing and fixing up response packets so that their IP addresses would match the IP address of the incoming packet (say, 5.5.5.5).

To investigate this, I started by looking at net/netfilter/xt_REDIRECT.c with the goal of learning whether the kernel was using things like the TCP port numbers I was mangling to try to keep track of what packets to fix up. I found that in the case of IPv4, redirect_tg4() calls nf_nat_redirect_ipv4() in nf_nat_redirect.c which unconditionally accesses conntrack information in the skb (short for socket buffer, i.e. the packet), finally calling nf_nat_setup_info() in nf_nat_core.c. The latter function manipulates the destination IP address and calculates a "tuple" and "inverse tuple" that will be used to identify corresponding packets by their endpoint (and other protocol characteristics) and fix up any fields that were mangled by the NAT logic.

I was surprised conntrack was involved because I hadn't needed to use the -m conntrack argument to implement redirection. To confirm what I was seeing, I used lsmod to peek at the dependencies among Netfilter modules. Sure enough, I found that xt_REDIRECT.ko (which implements the REDIRECT target in my iptables rule) relies on nf_nat.ko, which itself relies on nf_conntrack.ko.

I still didn't have the full picture, but it seemed more and more like I was on to something. Perhaps the system was calculating a "tuple" based on the TCP destination port of the incoming packet, my code was modifying the TCP destination port, and then the system was getting a whack at the response packet before I had a chance to fix up its TCP source port to something that would result in a match.

I wanted to figure out when the REDIRECT logic was executing versus when my own logic was executing so I could confirm that hypothesis. While I puzzled over this, I happened upon some relevant documentation that led me to believe I might be correct about the use of TCP ports (rather than, say, socket ownership) to track connections:

Yeah dummy. It's the port.

This documentation also answered my question of when the NAT tuple calculations occur:
Connection tracking hooks into high-priority NF_IP_LOCAL_OUT and NF_IP_PRE_ROUTING hooks, in order to see packets before they enter the system.
These chains were consistent with the registration structures in xt_REDIRECT.c, which further indicated that the hooks were specific to the nat table (naturally):

static struct xt_target redirect_tg_reg[] __read_mostly = {
 .
 .
 .
    {
        .name       = "REDIRECT",
        .family     = NFPROTO_IPV4,
        .revision   = 0,
        .table      = "nat",
        .target     = redirect_tg4,
        .checkentry = redirect_tg4_check,
        .targetsize = sizeof(struct nf_nat_ipv4_multi_range_compat),
        .hooks      = (1 << NF_INET_PRE_ROUTING) |
                      (1 << NF_INET_LOCAL_OUT),
        .me         = THIS_MODULE,
    },
};

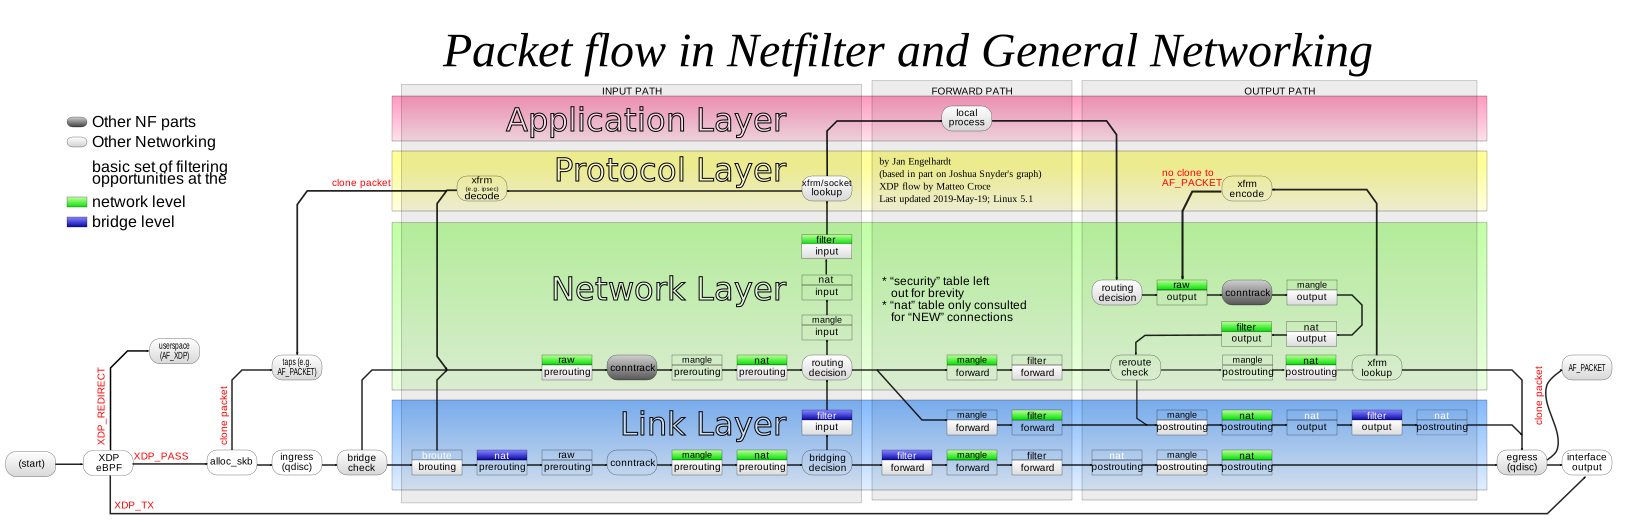
At this point, I really wanted a way to beat Netfilter's OUTPUT/nat hook to the punch. I needed to fix up the source port of the response packet and see if I could induce Netfilter to calculate correct inverse-tuples and fix up the source IPs in my response packets again. But the documentation says Netfilter implements its connection tracking using high-priority hooks in the NF_IP_LOCAL_OUT and NF_IP_PRE_ROUTING chains. That sounds a lot like Netfilter gets first dibs. I sat in uffish thought until I remembered this very detailed diagram (click to enlarge):

You are here. No, wait.

If this graphic was correct, I was about to get in before Netfilter -- by changing my fix-up hook to run in the OUTPUT/raw chain and table. I gave it a shot, and...

root@ubuntu:/home/mykill# echo asdf | nc -v 5.5.5.5 9999
Connection to 5.5.5.5 9999 port [tcp/*] succeeded!
asdf

VICTORY!

It was a hard-fought battle, but I actually was able to confirm my suspicions thanks to the very readable code in the Netfilter portion of the kernel and some very helpful documentation. It's fun to be working on Linux again!

Sunday, October 23, 2016

The case for reinventing the wheel

I really like to use IDA Pro as my debugger, and shellcode is no exception. Initially I couldn't see why anyone would ever write their own loader for analyzing shellcode. Siko et al released shellcode_launcher.exe along with the Practical Malware Analysis labs, so why rewrite that code? shellcode_launcher.exe does the work of ReadFile / VirtualAlloc / VirtualProtect, et cetera, so I just make that my database and pull in the VirtualAlloc'd memory using IDA Pro's memory snapshot facilities. Then, I go to town.

Well, I changed my tune when I discovered that VirtualAlloc was not receptive to my suggestions for where to allocate memory. (WinDbg: bp <callsite>; g; ed esp <lpAddress>; p). Without a consistent shellcode base address, none of my annotations from the IDA memory snapshot I took were lining up with the actual shellcode in subsequent debug sessions.

Edit January 14th, 2018: At this point, we have a choose-your-own-adventure on our hands:

  • If you use remote debugging, and/or you like to see IDA Pro annotations superimposed over your debugger session, and your shellcode itself allocates additional memory and executes code there, then you might be better off reading my fireeye.com blog article titled Debugging Complex Malware that Executes Code on the Heap.
  • If you don't use remote debugging, then you might be satisfied capturing snapshots of your debugging VM at critical points in the debug session so you can iteratively debug and understand the shellcode.
  • Finally, if your shellcode does not execute additional code on the heap and you just want to give it a uniform memory map in which to iteratively debug it, then read on...
For simple cases, you can reinvent the wheel and write your own shellcode loader to force shellcode to live at the same virtual address each time you debug it. But no need to start from scratch; here's the path of least resistance...

Assuming you have the shellcode as a raw binary, use xxd's feature of outputting shellcode as a C include file:

xxd -i myshellcode > myshellcode.c

That gives you a hexdump in C form:

unsigned char myshellcode[] = {
    0x55, 0x8b, 0xec, 0x01, 0x23, 0x45, 0x67, 0x89, 0xab, 0xcd, 0xef, 0x01,
    0x01, 0x23, 0x45, 0x67, 0x89, 0xab, 0xcd, 0xef, 0x01, 0x23, 0x45, 0x67,
    ...
    0x01, 0x23, 0x45, 0x67, 0x89, 0xab, 0xcd, 0xef, 0x01, 0x23, 0x45, 0x67,
};
unsigned int myshellcode_len = 4242;

So now, write your loader:

#include "myshellcode.c"

typedef void (*fptr)(void);

int
main(void)
{
    fptr sc = (fptr) myshellcode;
    __asm int 3 ; Safety - so I don't execute this on my analysis box (or worse!)
    sc();
}

Then do this (in an SDK prompt):

cl.exe loader.c

If you don't have Visual Studio, just get Microsoft's compiler for Python 2.7.

After compiling and linking, you'll get this:


I was worried about execute permissions when calling into my shellcode, but happily, it Just Works, perhaps because I ran cl.exe directly without using Visual Studio to specify its usual flags. The program loads in IDA as a PE-COFF, it can be debugged using IDA's debugging plugins, and the shellcode is always at the same address (in my case, unk_40A000). Therefore, you can annotate the shellcode without using the IDA Pro memory snapshot facilities to save it from a debugger session, and (this is the important part) without worrying that VirtualAlloc will return a different address during the next debug session, rendering your annotations less useful to you. The same applies to breakpoints: they will actually work, from session to session. That makes life easier.

Friday, March 18, 2016

CPUID, SMSW, and Other Delights

I wrote a quick and dirty utility to collect info a la redpill, nopill (props to Danny Quist but I can't find that whitepaper anymore!), etc. Nothing really novel about it, but I thought others may find it useful for researchy scenarios. I used it to investigate a hypervisor running on an Intel microprocessor, so each output line includes an indication of whether VMX appears to be supported. My intent was to train a Bayes learner to identify systems that are lying about whether they support VMX (thus likely detecting a hypervisor), similar to a previous project of mine, except in the course of this project, that became so very unnecessary.

Here is a snippet of its output:

So hex. Much flashy.
This tool works by creating and affinitizing a thread to each logical CPU in the system, executing a few compiler intrinsics and assembly functions, and outputting the desired information for each CPU. Like most research code I post, this tool is only as complete as I needed it to be for my own purposes. Therefore, it does not support 32-bit platforms, does not collect the value of the SLDT instruction from each processor, and is not meant for AMD microprocessors. If you can tolerate all that, then the source code is here:


For more information about CPUID and using microprocessor instructions, I thought the book Professional Assembly Language Programming was very helpful, and of course, the Intel 64 and IA-32 microprocessor manuals are the authoritative reference on all things Intel x86 and x64.

Sunday, February 28, 2016

Snooping on Myself for a Change

Premise

When I started red teaming, I would often want to know the answers to impossible questions while writing my post-assessment report:
  • What was that command I used that I didn't think would be important to making my point, but now I realize it is?
  • The output indicated a Windows error message - which error was it?
  • Which IP address was leased to me when I did that?
Naturally a red teamer should always be taking copious screenshots, recording IP addresses frequently, and incrementally reporting in tandem with the engagement. But knowing what will be significant later is sometimes a challenge. It would be nice to have a backup.

In this post, I talk about researching and constructing a tool for logging 32-bit cmd.exe commands and output local to one's Windows attack VM. Then I discuss limitations and post source code. I've wanted to do this for a while, but I recently had a project that gave me an excuse to use Detours, so while I was at it, I decided to quickly knock out this project.

Tools

Microsoft Research produced a very useful tool for both investigating this problem and developing a solution, called Microsoft Detours. Detours is a library for hooking Win32 APIs, which allows one to instrument and extend binary applications. The non-commercial version can be downloaded for free, but only covers 32-bit architectures. This will suffice for our proof of concept. These techniques are older than 1999, so I leave it as an exercise for the student to extend this to 64-bit.

One of the Detours samples, named traceapi, hooks 1,401 Windows API functions, and can provide detailed insight into how an application works. Meanwhile, another Detours sample, named simple, shows an example of hooking and extending the Windows SleepEx API. This is all we need to get started.

Investigation

To use the traceapi sample, you must copy the Detours root to a writable directory, open a 32-bit Windows SDK Prompt, and invoke nmake from the samples directory. The bin.x86 Detours sub-directory will contain many files, including the following tools necessary to this exercise:
  • traceapi.dll (or trcapi32.dll - I seem to recall getting different results depending upon how I built this)
  • withdll.exe - for loading an application with a DLL in its address space
  • syelogd.exe - for logging trace output from Detours tools
When using traceapi, I expected to find patterns including CreateFile(CONIN$) / ReadFile, or some such. Then I anticipated hooking functions to record which handles corresponded to CONIN$, CONERR$, and CONOUT$ so that I could know which ReadFileW and WriteFileW activity corresponded to console input and output.

To begin the investigation, I launched syelogd.exe to log to a file, as follows:

C:\Users\someone\Detours\bin.x86> syelogd.exe trace_cmd.log

I then launched the 32-bit cmd.exe with traceapi.dll in its address space to begin tracing:

C:\Users\someone\Detours\bin.x86> withdll.exe /d:traceapi.dll C:\Windows\SysWOW64\cmd.exe

At this point, I typed a few commands like DIR and EXIT, and then terminated syelogd.exe.

Ah, beautiful trace output

What I found was happily contrary to my expectations...

Found the "Easy" button

The Windows command interpreter uses the ReadConsole and WriteConsole APIs for reading to and writing from the console. All the easier to hook, with no state tracking required.

Development and Features

The Detours sample named simple contains all you need to get started. Copy that folder, name it something else, update the Makefile, and get cooking. One bump I ran into and hacked up a fix for was that the 32-bit rc.exe crashed when executing it within my 32-bit Windows SDK Prompt. This is why my own Makefile (not uploaded) directly references the 64-bit rc.exe.

Logging

To customize the sample code to do my bidding, I followed the simple example's hooking pattern to first hook ReadConsoleW and WriteConsoleW. My initial logging hooks simply returned the value of the real functions just for testing purposes. I then tried printf("WriteConsole: %S", lpBuffer) to test whether I could output the data, and finally opened a file within the DllMain function.

Here is an example of the logging for a call to net.exe:
Logs for days
Why is there a separate log for each process? Because my DLL creates a new, unique log every time it is loaded. See the Limitations section below for discussion.

Why does net.exe create two logs? Because net.exe calls out to net1.exe to do its work.

IP Address Logging

I expected to have to use some sort of COM API, but instead there's this convenient GetAdaptersInfo API. Easy-peasy :)

Status Command

I wanted a way of knowing for sure that logging was enabled, without typing EXIT and having my parent prompt close on me. So, I implemented a secret command, REM status. Because my command begins with the REM command, it will be ignored by the command interpreter but intercepted by my hook on its way to the application.

BOOL WINAPI
LogReadConsoleW(
  HANDLE  hConsoleInput,
  LPVOID  lpBuffer,
  DWORD   nNumberOfCharsToRead,
  LPDWORD lpNumberOfCharsRead,
  PCONSOLE_READCONSOLE_CONTROL pInputControl
)
{
    BOOL ret = pReadConsoleW(
        hConsoleInput,
        lpBuffer,
        nNumberOfCharsToRead,
        lpNumberOfCharsRead,
        pInputControl
       );

    /* TODO: Replace this crap code with more accurate parsing */
    if (!wcsncmp((const wchar_t *)lpBuffer, CMD_QUERY_STATUS,
                wcslen(CMD_QUERY_STATUS)))
    {
        printf("Logging to %s\n", cmdlog_fname_expanded);
        LogInfoStampToFile(stdout);
    }

    LogToFile(cmdlog, "%S", lpBuffer);
    State = clsLabel;

    return ret;
}

The result is satisfactory. I type REM status, and if I'm hooked, I see a nice little confirmation that logging is enabled, including the log file name and some IP address information.

Yes, Neo, you are in the Matrix.

Limitations

Otherwise known as "problems I don't plan to solve until I get a copy of Detours Enterprise and some more time." The last 10% always takes 90% of the time, amirite?

Single-File Logging

This will probably entail using IPC, and some IPC mechanisms (like named pipes) cannot be initialized in DllMain because they could cause a deadlock by precipitating an attempt to acquire the loader lock (check out Microsoft's article on DLL best practices). This means writing "lazy initialization" code. I leave this as an exercise for the student.

Another scheme is for each child to share a log file with the parent process whose name is based on the PID of the top-most parent of the current process that has our DLL loaded in its address space. The APIs used to do this might entail a LoadLibrary or some APIs that violate DLL best practices, so again... Exercise left for the student.

Alternately, I could just open and close a single logfile with a single name, but then if I open several logged command prompts, one may fail to get access to the log as another is writing to it (say, if I'm running a command that outputs continuously while running another command in the other prompt). So, I didn't do that.

Cross-Architecture Process Creation

Because Detours Express is only for 32-bit, we have no 64-bit DLL. So here's what happens when you try to load a 64-bit process...

Nope.
Hooking 64-bit, while fun, is not something I have time for right now (I'm a father; give me a break). But my employer has a license for 64-bit, so perhaps I will extend this later. How? I anticipate that I will use the ImageHlp APIs or something to figure out whether the CreateProcess call is for a 32- or 64-bit process, and then load the appropriate DLL. Yay!

^M&^M's

If you open the output log files in something like gvim, you will see stray ^M's (character 0x0d) all over the place. Yuck. But a quick swipe of the %s/^M//g in gvim eliminates these, so I just can't bring myself to care.

Source Code

As is frequently the case with my spare-time experimentation, this code is proof of concept only. If it doesn't compile because I didn't close a pair of parentheses, rest assured that it's because I had to drop everything and rush over to my young daughter to prevent her from acquainting herself with an electric socket. Forgive me. But hopefully the thought process published here and the examples available in the code will help you think of new ways to solve problems.

The code is here: https://github.com/strictlymike/tools/tree/master/cmdlog

Sunday, June 14, 2015

Everything is broken

In some cases doing malware triage, you may find yourself following up on invalid PE checksum or other anomalies. In these cases, it is interesting to know not only what the checksum in the file is, but also what it should be.

Gotcha

Using the FOR /R command, I thought I would casually see how many files on my system have zero or incorrect checksums...

@ECHO OFF

SET LOG=%~dpn0.log
SET TO_LOG=^>^> "%LOG%" 2^>^&1

SET MFACS=%USERPROFILE%\Documents\MapFileAndCheckSum\mfacs32.exe

:Recurse
    FOR /R %SystemDrive%\ %%f IN (*.exe *.dll *.ocx *.cpl *.scr *.ax) DO (
        ECHO %%f %TO_LOG%
        "%MFACS%" "%%f" %TO_LOG%
    )
    GOTO :EOF

As it turns out, they number in the thousands. Non-zero invalid checksums were significantly less numerous than zero checksums, but still surprisingly frequent, including many signed binaries.

So, it's not a very good sign of badness all by itself. Even so, I found that PE checksums might still be able to tell you one or two interesting things about a binary and the (type of) person who built it:

  • 0x00000000 - That this is not a "release" version of the binary, or that the developer uses the command line or some other non-Visual Studio build system, and has omitted the /RELEASE linker flag, causing link.exe to omit the computation and insertion of the PE checksum. So perhaps your coder is a command line-oriented person?
  • Mismatch - That the binary has been modified after it was compiled, or perhaps that a toolchain other than Microsoft's was used to create the binary.

There might be other conclusions that could be drawn as well. In any case, the source code for the utility, which is really just a command-line wrapper for the Imagehlp!MapFileAndCheckSum function, can be had here:

https://github.com/strictlymike/mfacs

Monday, May 11, 2015

Top Me Not

Why did the developers at Adobe decide that their update dialog should cover ALL the other windows until it is satisfied? It is, to say the least, a bit of a stumbling block. What if I booted my computer to do something important, like -- use it? What if I have to troubleshoot my Internet connection before the download can start? Here is what that scenario would look like:

Oh, am I in your way? What about now?

Yeah, there's enough screen real estate to just move my window aside. Or I can humbly admit defeat and drag the window to the bottom of the screen until I am done with what I am doing. But the program should bend to my will, not the other way around. For whatever reason, the Adobe developers think they know better than their users which windows should be at the very tippy-top of the Z-order. So, to me, the Adobe update dialog reads a lot like this:

Wait, was that in the EULA?

Since this annoys me so much, I set out to write a program to deal with it. I know there are programs out there, but I don't trust those programs. Plus, I wanted to know how to do this.

After a little bit of searching, I figured out that windows that behave this way do it by rudely and deliberately specifying the HWND_TOPMOST pseudo-handle as the window to be inserted after when calling the SetWindowPos() function. The same documentation that told me about that also described an HWND_NOTOPMOST pseudo-handle for undoing that effect.

I started out by aiming to develop a command-line tool using the same function I used in the screenshot program, namely user32!FindWindow(). This turned out to work nicely: FindWindow() gave me the handle of the window I wanted to target, and SetWindowPos() allowed me to knock it down a rung on the Z-order.

At this point, I almost wrote a note to StackOverflow asking how SysInternals implemented the cool "pick a process" cursor in Process Explorer, but then I decided to try to figure it out myself. I started out with a sample program I'd created based on a pretty decent Windows programming tutorial. I reasoned that the difficulties would be (1) getting mouse input when the cursor is outside of my window, and (2) making the cursor into a crosshairs.

It turned out that the second of these was easiest. I started with the wrong answer first: using SetSystemCursor() to set the normal system-wide cursor (OCR_NORMAL) to the crosshairs until I was finished. Using this along with SetCapture(), I was able to receive and process a WM_LBUTTONUP message even when the mouse was outside my window. But, I discovered that if I didn't save a copy of the regular arrow cursor using CopyCursor() as the documentation said to do, then there was no getting the arrow cursor back. A little bit of RTFM led me to a second prototype wherein you would click down on a window (like in Process Explorer) and release the left mouse button while the cursor is over whatever window you want to shatter at that particular moment. That allowed me to use the more friendly SetCursor() function to change the cursor until the mouse button was released. The result was a tool that I like to call "Top Me Not":

My new boom stick.
As it turned out, the next day, I learned that the popular and useful PEiD analysis tool sometimes likes to take the foreground, too. Well, guess what I did.

Who's on top now? Huh? HUH?

Since then, I've updated the tool to support the /? help argument and provide detailed information on its usage:

Help, at last!

Since you're likely as paranoid as I am, you probably don't want to trust some random hacker to provide you with a binary. Hence, the full source code can be found here:

https://github.com/strictlymike/TopMeNot

Next time a program tries to show you who's boss, go put it in its place.

Sunday, March 1, 2015

Not Exactly Charming

I've been annoyed with charms menu.  Most of the time, it extends in front of legitimate controls I am trying to click in my browser, evoking the "I'm TRYING to $@#!ing work here!" response from me.

A month ago, I found windows.immersiveshell.serviceprovider.dll in Process Explorer, and wondered if this had to do with the Charms bar.  I looked it up, and found an article that describes steps to use SysInternals' Process Explorer to terminate the thread that is running code within this "Immersive Experience" library.  In closing, the author states that using Process Explorer is not automatic (it entails user interaction), and that s/he hopes someone finds an effective way to disable the immersive start menu.

I found another article suggesting that the Registry affords this functionality.  I tested it, finding that it indeed does.  The relevant registry keys are:

[HKCU\Software\Microsoft\Windows\CurrentVersion\ImmersiveShell\EdgeUi]
DisableTLCorner=1
DisableCharmsHint=1

I also think that following the advice I found of right-clicking the taskbar to arrive at Properties and selecting the Navigation tab may have helped me locate a control to add another registry entry that has reduced the annoyance factor of the Windows 8 UI.  The relevant registry key was:

[HKCU\Software\Microsoft\Windows\CurrentVersion\ImmersiveShell\EdgeUi]
DisableTRCorner=1

A command script for making all these changes at the same time follows:

REG ADD HKCU\Software\Microsoft\Windows\CurrentVersion\ImmersiveShell\EdgeUi /v DisableTRCorner /d 1 /f
REG ADD HKCU\Software\Microsoft\Windows\CurrentVersion\ImmersiveShell\EdgeUi /v DisableTLCorner /d 1 /f
REG ADD HKCU\Software\Microsoft\Windows\CurrentVersion\ImmersiveShell\EdgeUi /v DisableCharmsHint /d 1 /f

Nevertheless, I thought I'd see if I could implement something similar to the "Kill Thread" function in SysInternals' process explorer.  The result can be found here on my Github:

https://github.com/strictlymike/charmkiller

It is based on the following two articles:
What didn't initially occur to me was that there is no API for enumerating threads associated with a particular module.  There is, however, the fact that a thread has a start address property that indicates what code was first executed when the thread was started.  As long as no indirection is incorporated (such as a dispatch function that uses arguments to determine what code is subsequently executed), and no tampering has been undertaken by the target process for any reason such as obfuscation (not sure if this structure is in the PEB or kernel), it is possible to classify a thread as being associated with a particular library by assessing whether the thread's start address lies within the base and end address of that library.  So, that's what I did.  Thanks, Rohitab!  See the code for more details.

The end result was a program that is capable of locating and terminating the thread that handles Immersive Experience events such as the charms menu.  Alas, that thread also handles things like wireless network configuration and the start menu which I commonly use to invoke programs whose locations I do not know, such as the Windows SDK prompt.  So, I would recommend trying the registry maneuvers first, restarting explorer to evaluate.  Regardless, the source code for the project I created could still be useful in the general sense for terminating specific threads in arbitrary processes.  Not sure I can think of an example, but nonetheless, it's out there, just in case ;-)