 |
| I'm just going to paste the whole thing here and draw emoticons on it |
Scope
Several challenges make performance profiling and diagnosis of deployed applications a difficult task:
- Difficulty reproducing intermittent issues
- Investigation inhibited by user interface latency (UI) due to resource consumption
- Unavailability of appropriate diagnostic tools on user machines
- Inability of laypeople to execute technically detailed diagnostic tasks
- Unavailability of live artifacts in cases of dead memory dump analysis
My studies have included two following types of disruptive resource utilization:
- User interface latency due to prolonged high CPU utilization
- User interface latency due to prolonged high I/O utilization
I'll just be talking about CPU here.
Where applicable, this article will primarily discuss automated means for solving the above problems. Tools can be configured to trigger only when issues appear that are specific to the software and issues that the diagnostic software is meant to address. Where feasible, I will share partial software specifications, rapidly prototyped proofs of concept (PoCs), empirical results, and discussion of considerations relevant to production environments.
Where applicable, this article will primarily discuss automated means for solving the above problems. Tools can be configured to trigger only when issues appear that are specific to the software and issues that the diagnostic software is meant to address. Where feasible, I will share partial software specifications, rapidly prototyped proofs of concept (PoCs), empirical results, and discussion of considerations relevant to production environments.
Prolonged High CPU Utilization
Automated diagnostics in general can be divided into two classes: (1) those that are meant to identify conditions of interest (e.g. high CPU utilization); and (2) those that are meant to collect diagnostic information relevant to that condition. Each is treated subsequently.
Identifying Conditions of Interest
For purposes of this discussion, two classes of CPU utilization will be used: single-CPU percent utilization and system-wide percent CPU utilization. Single-CPU percent utilization is defined to be the percent time spent in both user and kernel mode (Equation 1); system-wide CPU utilization is defined to be the same figure, divided by the number of CPUs in the system (Equation 2). For example, if a process uses 100% of a single logical CPU in a four-CPU system, its system-wide CPU utilization is 25%. System-wide CPU utilization is the figure that is displayed by applications such as taskmgr.exe and tasklist.exe.
$$u_1=\frac{\Delta t_{user} + \Delta t_{kernel}}{\Delta t}$$
(Eq. 1)
$$u_2=\frac{u_1}{n_{cpus}}$$
(Eq. 2)
High CPU utilization can now be defined from the perspective of user experience. Single-threaded applications will only be capable of consuming <100% of the CPU time on a single CPU (e.g. on a two-CPU system, <50% of system CPU resources). Multi-threaded applications have a much higher potential impact on whole-system CPU utilization because they can create enough CPU-intensive threads to run all logical CPUs at 100%. For purposes of this article, 85% CPU system-wide CPU utilization or greater will constitute high CPU utilization.
As for prolonged high CPU utilization, that is a subjective matter. From a user experience perspective, this can vary depending upon the user. For purposes of this article, high CPU utilization lasting 5 seconds or greater will be considered to be prolonged high CPU utilization. In practice, engineers might also need to consider how to classify and measure spikes in CPU utilization that occur frequently but for a shorter time than might constitute "prolonged" high CPU utilization; however, these considerations are left out of the scope of this article.
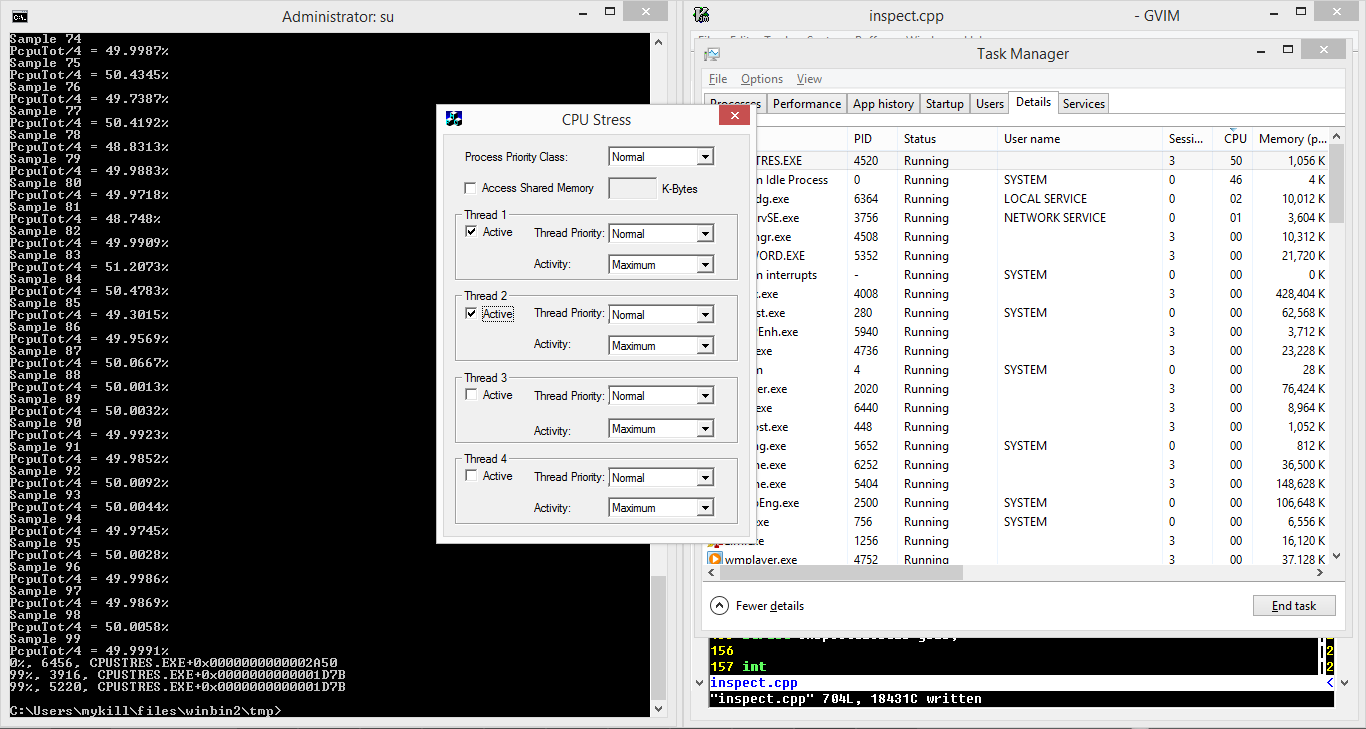
I've implemented a Windows PoC (trigger.cpp) to assess the percent CPU utilization (both single-CPU and system-wide) for a given process. I don't know of any APIs for process-wide or thread-specific CPU utilization, but Windows does expose the GetProcessTimes() API which can be used to determine how much time a process or thread has spent executing in user and kernel space over its life. I've used this to measure the change in kernel and user execution times versus the progression of real time as measured using the combination of the QueryPerformanceCounter() and QueryPerformanceFrequency() functions. Figure 1 shows the PoC in operation providing processor utilization updates that closely track the output of Windows Task Manager. The legacy SysInternals' CPUSTRES.EXE tool was used to exercise the PoC.
 |
| Fig. 1: CPU utilization tool |
There's one more thing to think about. If a diagnostic utility is executed indefinitely, it would be nice to make it consolidate successive distinct CPU utilization events into a single diagnostic event.
For example, the CPU utilization graph in Figure 1 below depicts a single high-CPU event lasting from $t=50s$ through $t=170s$. Although there are two dips in utilization around $t=110s$ and $t=150s$, this would likely be considered a single high-CPU event from both an engineering and a user experience perspective. Therefore, rather than terminating and restarting monitoring to record two events, a more coherent view might be obtained by recording a single event.
 |
| Fig. 2: Single high CPU utilization event with two short dips |
A dip in utilization might also represent a transition from one phase of high CPU utilization to another, in which the target process performs markedly different activities than prior to the dip. This information can be preserved within a single diagnostic event for later identification provided that sufficiently robust data are collected.
One way to prevent continual collection of instantaneous events and to coalesce temporally connected events together is to define a finite state machine that implements hysteresis. Thresholds can be defined and adhered to in order to satisfy both the definition of "prolonged" high CPU utilization and the requirement that diagnostic information is not collected multiple times for a single "event". Such a state machine could facilitate a delay before diagnostics are terminated and launched again, which can in turn prevent the processing, storage, and/or transmission of excessive diagnostic reports representing a single event. Figure 3 depicts a finite state machine (FSM) for determining when to initiate and terminate diagnostic information collection.
 |
| Fig. 3: It's an FSM. Barely. |
The state machine in Figure 3 above would be evaluated every time diagnostic information is sampled, and would operate as follows:
- The machine begins in the Normal state.
- Normal state is promoted to High CPU at any iteration when CPU utilization exceeds the threshold (85% for purposes of this article).
- When the state is High CPU, it can advance to Diagnosis or regress to Normal, as follows:
- If CPU utilization returns below a threshold before the threshold number of seconds have elapsed, then this does not qualify as a "prolonged" high CPU utilization event, and state is demoted to Normal;
- If CPU utilization remains above the threshold utilization value for the threshold number of seconds, then diagnostics are initiated and state is promoted to Diagnosis.
- The Diagnosis state is used in combination with the Normal-Wait state to avoid continually repeating the diagnostic process over short periods. When the state is Diagnosis, it can either advance to Normal-Wait, or remain at Diagnosis. The condition for advancing to Normal-Wait is realized when CPU utilization for the target process falls below the threshold value.
- When the state is Normal-Wait, the next transition can be either a regression to Diagnosis, no change, or an advance back to the Normal state:
- If the CPU utilization of the target process returns to high utilization before the time threshold expires, the threshold is reset and the state regresses to Diagnosis. In this case, diagnostic information collection continues.
- If CPU utilization remains low but the threshold duration has not elapsed, the state machine remain in Normal-Wait.
- If the CPU utilization of the target process remains below the threshold value for the threshold duration, then diagnostics are terminated, the state transitions back to Normal, and the machine can return to a state in which it may again consider escalating to further diagnostics of subsequent events.
The accuracy of this machine in identifying the correct conditions to initiate and terminate diagnostic information collection could be improved by incorporating fuzzy evaluation of application conditions, such as by using a moving average of CPU utilization or by omitting statistical outliers from evaluation. Other definitions, thresholds, and behaviors described above may be refined further depending upon the specific scenario. Such refinements are beyond the scope of this brief study.
Collecting Diagnostic Information
When prolonged high CPU utilization occurs, the high-level question on the user's mind is: WHAT THE HECK IS MY COMPUTER DOINGGGGGG????!!
And to answer this question, we can investigate where the application is spending its time. Which, incidentally, is available to us through exposed OS APIs.
To address where the application is spending its time, two pieces of information are relevant:
- What threads are consuming the greatest degree of CPU resources, and
- What instructions are being executed in each thread?
This information may allow engineers to identify which threads and subroutines or basic blocks are consuming the most significant CPU resources. In order to obtain this information, an automated diagnostic application must first enumerate and identify running threads. Because threads may be created and destroyed at any time, the diagnostic application must continually obtain the list of threads and then collect CPU utilization and instruction pointer values per thread. The result may be that threads appear and disappear throughout the timeline of the diagnostic data.
Ideally, output would be to a binary or XML file that could be loaded into a user interface for coherent display and browsing of data. In this study and the associated PoC, information will be collected over a fixed number of iterations (i.e. 100 samples) and displayed on the console before terminating.
For purposes of better understanding the origin of each thread, it can be useful to obtain module information and determine whether the thread entry point falls within the base and end address of any module. If it does, then slightly more informational name information, such as modname.dll+0xNNNN, can be displayed. Note that I said slightly more informational. Sometimes this just points to a C runtime thread start stub. But it's still worth having.
In the PoC, data is displayed by sorting the application's threads by percent utilization and displaying the most significant offenders last. Figure 4 shows threads from a legacy SysInternals CPU load simulation tool, CPUSTRES.EXE, sorted in order of CPU utilization.
 |
| Fig. 4: Threads sorted in ascending order of CPU utilization |
Although this answers the high-level question of what the program is doing (i.e., executing the thread whose start routine is located at CPUSTRES.EXE+0x1D7B in two separate threads), it does not indicate specifically what part of each routine is executing at a given time.
To answer more specific questions about performance, two techniques are available:
- Execution tracing
- Instruction pointer sampling
Execution tracing can be implemented to observe detailed instruction execution by using either single-stepping via Windows debug APIs or by making use of processor-specific tracing facilities. Instruction pointer sampling on the other hand can be implemented quickly, albeit at a cost to diagnostic detail. Even so, this method offers improved performance since single-stepping is ssssllllloooowwwwwwwwwwww.
This PoC (inspect.cpp) implements instruction pointer sampling by suspending each thread with the SuspendThread() function and obtaining the control portion of the associated thread context via the GetThreadContext() function. Figure 5 depicts the PoC enumerating instruction pointers for several threads within taskmgr.exe. Notably, thread 3996 is executing a different instruction in sample 7 than it is in sample 8, whereas most threads in the output remain at the same instruction pointer across various samples, perhaps waiting on blocking Windows API calls.
 |
| Fig. 5: Instruction pointer for thread 3996 |
This information can provide limited additional context as to what the application is doing. More useful information might include a stack trace (provided frame pointers are not omitted for anti-reverse engineering or optimization reasons).
Conclusion
It's nice to be able to identify and collect information about events like this. But CPU utilization is only one part of the problem, and there are other ways of detecting UI latency than measuring per-process statistics. Also, what of inherent instrumentation available for collecting diagnostic information? What of kernrate, which was mentioned in Windows Internals book and is covered here. It looks as if this can be used instead of custom diagnostics, as long as there are sufficient CPU resources to launch it (either via starting a new process or by invoking the APIs that it uses to initiate logging). Would kernrate.exe (or the underlying APIs) suffer too much resource starvation to be useful in the automatically detected conditions I outlined above? In addition to this, what ETW information might give us a better glimpse into what is happening when a system becomes frustratingly unresponsive?
These are the questions I want to dig into to arrive at a fully automated system for pinpointing the reasons slowness and arriving at human-readable explanations for what is happening.


