Saturday, November 5, 2016

Teachers


We've moved into our new home, and I was putting away all my computing books. This time, I decided to put them in a deliberate order, starting with the books that I read as a kid and moving on through the system layers, my education, my work, and my dabbling. Each time I see these books, they retell the story of how my curiosity grew into a professional pursuit, and they remind me how happy I am that I was able to connect with such an interesting profession. They make me think of my teachers...

During the summers, I spent a lot of time at my grandmother's house. One summer, my dad brought an old Compaq portable that the army had retired, and he set it up in the play room in her basement. I recall that the monitor supported b&w, amber, and green. Naturally, I preferred green. I used this to run newps.exe (The New Print Shop - you can play it on archive.org).


Newps allowed me to create small monochrome images (probably 64x64 pixels) and store a few dozen of them to a "folder". I learned that if I scrolled through the images by holding the down arrow, they would display sequentially, which allowed me to build short animations. I used this to create my masterpiece: a hand-dithered animation of my cousin, winking. Wow.

My dad also sometimes took me to the office with him and let me play on the computer. I remember playing some sort of DOS game and accidentally winding up in the GW-BASIC interpreter. I must have broken the game, because I saw a clubs suite, little faces, greek letters, and a mess of other inscrutable data pour out onto the screen. My dad told me these were called "characters", and that programmers probably used some of those characters to write the program. This idea blew my mind - the concept that something visual, graphical, animated - was written by someone. After that, every time I came in contact with a computer, I was preoccupied with working out what my dad must have meant when he said that software could be "written".

My dad later brought home an NEC laptop with Windows 3.11, and I stared closely at the dithering that was used to produce a realistically colored eel using 256 colors. Thinking of that thick laptop with the tiny screen reminds me that my dad was the first person to tell me to RTFM. When I wanted to understand how to play Rodents' Revenge, draw with MS Paint, or use a DOS command, he told me to read the help file.


After a while, CDs became more and more common, and the games I wanted to play were not available on floppy disks. I begged my dad for a CD-ROM drive until, one day, he walked in and threw one on my bed. When I asked him to install it, he told me to do it myself, and when I asked him how, he said "read the instructions." As a 13-year-old, I felt helpless and sorry for myself for about a split second. That was the day I learned about config.sys, emm386.exe, autoexec.bat, and mscdex.exe.

And then, RTFM I did. I somehow wound up with a copy of Dan Gookin's DOS for Dummies, which introduced me to EDIT.COM, boot disks, AUTOEXEC.BAT, and CONFIG.SYS. That summer, I became addicted to reading HELP.EXE while listening to techno all night. I unnecessarily used RAM drives to "accelerate" my file access. I used the VSAFE.COM TSR to protect myself from viruses (uh, right). I hid files from my family by placing them inside of compressed volume files (*.CVF) and applying file attributes to hide them. I had nothing worth hiding, but I just wanted to be able to hide stuff. Out of ignorance or unavailability of BIOS features, I wrote a batch file that used CHOICE.COM to password protect my computer and prevent my dad from taking up space with Internet Explorer 3.0 when I was a diehard Netscape Navigator user. And of course, I used filemgr.exe to delete Net Nanny. (Holy crap, are they still in business?!)

Then when I was in high school, my dad gave me a computer that went with me to my mom's house and had Windows 3.11 on it. My friend asked if it had a modem and I said yeah, but no AOL. He decided to come over, and the minute he saw it, he connected it to the phone line, popped up Terminal, and dialed into the DEC VAX at the University of Wisconsin - Milwaukee (UWM). From there, he ran telnet and connected to jgsdos.brooktrout.com, port 5000, and it was then that I learned about Zolstead's MUD (Multi-User Dungeon). The fact that a buddy could just walk up to a computer he had never seen before and connect over a phone line to a computer and then to another computer from there, once again blew my mind.

After that, it mushroomed. I found QBASIC.EXE and learned to write software. Awful software! But software, nonetheless. I started reading about C and my dad got me books about that. My friend introduced me to his buddy who, at the age of 14 or 15, seemed to already know everything about computers. While evading my girlfriend's parents, I hid at the public library and checked out an 800-page beginner's book on C++. I read the entire book before it was due back at the library and took copious notes. I was so intent on learning C++ that I wanted to buy a compiler, but Visual Studio was way too expensive, so I bought Boreland C++ 3.1, for $30.
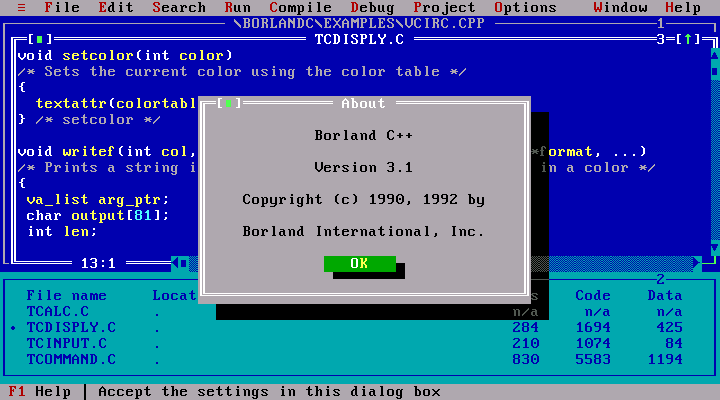
High tech.
After that, I started looking around for where I could get more of this. I audited classes at UWM and attended two semesters of C++ courses at MSOE. When I realized that this was what college could be like, I just barely pulled out of my academic nose dive and persuaded the MSOE admissions staff that I was worth making an exception for.

I fondly remember many dozens of teachers and moments on the journey. My grandmother, who did me the incredible favor of teaching me to type. It was one of those boring basics that made everything else easier. John Carmack, who innovated video games and made me wonder about the connection between mathematics and 3D graphics. My cousin, who patiently explained, multiple times, the difference between RAM, CPU, hard disks, and floppy disks; let me use his AOL account; introduced me to GIFs; and repeatedly reminded me how to get my computer to run Gorillas.


Then there were the teachers of my professional career. Professors, University staff, and in later years, other students. My boss at my first job. The friend who saw me reading about shellcode and Linux drivers and decided to pull me into a community of hackers. The people I worked with there. And as a consultant. And as a reverse engineer.

Now, I see almost everyone I meet or know or even read about as a teacher. It's what we all are, because we're doing what we love and we want to connect other people with something we feel is very powerful. These books remind me of all the teachers I ever had. The MS DOS 5.0 user manual, Patterson & Hennesy's Computer Organization & Design, The Shellcoder's Handbook, Mastering Algorithms with C, Rootkits... My dad, my friends, my colleagues, and my co-workers.

To this day, I am trying to figure out what the sequence of events has to be to elicit and maintain a learner's interest in some discipline of study. The learners I am interested are young, old, and in-between. Here are some of my thoughts on how to engage them:
  • Get the learner past the "boring basics" that make everything else available, possible, and achievable.
  • Create opportunities for "magic moments" by exposing the learner to as many facets of our world as are available to you; when you see a "magic moment" take place, figure out how to encourage and help create more of them - gently though, because the moment you find yourself leading the horse to water, you will be disappointed to find that it is no longer thirsty.
  • Never let yourself get in the way of a learning opportunity. When you are asked to facilitate an obsession, provide the materials and let the learner do the work.
  • When we are willing to invest precious resources (time, education, or equipment), we show that we take the learner's studies seriously, and the learner has an opportunity to take themselves and their studies more seriously as well, which can lead to more focus and more courage.
  • Always be open to explaining how things work.
Maybe if I'm lucky, I will think of more things to add to this list.

Sunday, October 23, 2016

The case for reinventing the wheel

I really like to use IDA Pro as my debugger, and shellcode is no exception. Initially I couldn't see why anyone would ever write their own loader for analyzing shellcode. Siko et al released shellcode_launcher.exe along with the Practical Malware Analysis labs, so why rewrite that code? shellcode_launcher.exe does the work of ReadFile / VirtualAlloc / VirtualProtect, et cetera, so I just make that my database and pull in the VirtualAlloc'd memory using IDA Pro's memory snapshot facilities. Then, I go to town.

Well, I changed my tune when I discovered that VirtualAlloc was not receptive to my suggestions for where to allocate memory. (WinDbg: bp <callsite>; g; ed esp <lpAddress>; p). Without a consistent shellcode base address, none of my annotations from the IDA memory snapshot I took were lining up with the actual shellcode in subsequent debug sessions.

Edit January 14th, 2018: At this point, we have a choose-your-own-adventure on our hands:

  • If you use remote debugging, and/or you like to see IDA Pro annotations superimposed over your debugger session, and your shellcode itself allocates additional memory and executes code there, then you might be better off reading my fireeye.com blog article titled Debugging Complex Malware that Executes Code on the Heap.
  • If you don't use remote debugging, then you might be satisfied capturing snapshots of your debugging VM at critical points in the debug session so you can iteratively debug and understand the shellcode.
  • Finally, if your shellcode does not execute additional code on the heap and you just want to give it a uniform memory map in which to iteratively debug it, then read on...
For simple cases, you can reinvent the wheel and write your own shellcode loader to force shellcode to live at the same virtual address each time you debug it. But no need to start from scratch; here's the path of least resistance...

Assuming you have the shellcode as a raw binary, use xxd's feature of outputting shellcode as a C include file:

xxd -i myshellcode > myshellcode.c

That gives you a hexdump in C form:

unsigned char myshellcode[] = {
    0x55, 0x8b, 0xec, 0x01, 0x23, 0x45, 0x67, 0x89, 0xab, 0xcd, 0xef, 0x01,
    0x01, 0x23, 0x45, 0x67, 0x89, 0xab, 0xcd, 0xef, 0x01, 0x23, 0x45, 0x67,
    ...
    0x01, 0x23, 0x45, 0x67, 0x89, 0xab, 0xcd, 0xef, 0x01, 0x23, 0x45, 0x67,
};
unsigned int myshellcode_len = 4242;

So now, write your loader:

#include "myshellcode.c"

typedef void (*fptr)(void);

int
main(void)
{
    fptr sc = (fptr) myshellcode;
    __asm int 3 ; Safety - so I don't execute this on my analysis box (or worse!)
    sc();
}

Then do this (in an SDK prompt):

cl.exe loader.c

If you don't have Visual Studio, just get Microsoft's compiler for Python 2.7.

After compiling and linking, you'll get this:


I was worried about execute permissions when calling into my shellcode, but happily, it Just Works, perhaps because I ran cl.exe directly without using Visual Studio to specify its usual flags. The program loads in IDA as a PE-COFF, it can be debugged using IDA's debugging plugins, and the shellcode is always at the same address (in my case, unk_40A000). Therefore, you can annotate the shellcode without using the IDA Pro memory snapshot facilities to save it from a debugger session, and (this is the important part) without worrying that VirtualAlloc will return a different address during the next debug session, rendering your annotations less useful to you. The same applies to breakpoints: they will actually work, from session to session. That makes life easier.

Thursday, October 20, 2016

This one weird trick for decoding DLL malware strings

TL;DR: argtracker and ctypes. It's the ctypes part that surprised me. Read on to see why.

This procedure can make light work of decoding strings in a DLL that has a horrifying string decoder or contains a metric ton of strings. The first stage leans on code that's already out there, with a bit of duct tape to get to the second stage; the second stage is to load your malware and call into it. There's just one stick-in-the-mud limitation: it has to be a file you can load into your address space using LoadLibrary, such as a DLL. Otherwise, you have to use a different kind of tool (I'll discuss this later).

First of all, gather all the strings you want to decode. Jay Smith wrote a very cool tool for this that uses Vivisect to emulate code and locate arguments. It's called argtracker. Don't duplicate it like I was starting to do with idaapi. Please, for the love of all that is lazy, just download it and get it installed.

The IDA Python script below is basically the code from the FireEye blog with a second function added to print all the encoded strings out so you can feed them to the second stage of this procedure. If your strings aren't printable prior to decoding, then you'll need to change this up a bit.

import vivisect
import flare.argtracker as c_argtracker
import flare.jayutils as c_jayutils

# Obtain the address where each argument is referenced by the decoder along
# with the offset that was referenced
def get_first_push_arg(decoder):
    ret = []
    vw = c_jayutils.loadWorkspace(c_jayutils.getInputFilePath())
    tracker = c_argtracker.ArgTracker(vw)
    xrefs = idautils.CodeRefsTo(decoder, 1)
    for xref in xrefs:
        argslist = tracker.getPushArgs(xref, 1)
        for argdict in argslist:
            va_at, offset = argdict[1]
            ret.append(argdict[1])
    return ret

# Now go get each string
def print_va_off_and_contents(pushed_args):
    print('refva, off, argcontents')
    for (va_at, offset) in pushed_args:
        print(hex(va_at) + ', ' + hex(offset) + ', ' + GetString(offset, -1, 0))
        # https://www.hex-rays.com/products/ida/support/idadoc/283.shtml
        # 0 <= ASCSTR_C
        # 3 <= ASCSTR_UNICODE

Provide your decoder's virtual address to get_first_push_arg, and then supply the returned list to print_va_off_and_contents to get something you can massage into shape for the second stage. Yes, I know, I'm using print instead of Python's logging module. The title of this blog was actually going to have the word "lazy" in it. Maybe it still should. Anyway...

Second and final step: load the malware and call its decoder. The interesting thing I learned is that Python ctypes can call non-exported functions. What a happy surprise! First, you have to define a function prototype, then you obtain a callable by hooking that prototype to an address in your binary where the function lives. There are prototypes for stdcall (WINFUNCTYPE) and cdecl (CFUNCTYPE). We're using stdcall. Here's a convenient snippet along with the string decoding goodness.

from ctypes import *

# Modify all this
offset = 0x4321                             # Decoder offset in your mal DLL
strings = [                                 # Populate from stage 1 (above)
    [0x10001234, "ABCdef"],
    [0x10005678, "ZYX990"],
    ...
]
dll = cdll.my_malware_dll                   # Modify to load your DLL
prototype = WINFUNCTYPE(c_char_p, c_char_p) # Stdcall, accepts & returns char*

# Leave this alone
string_decoder_addr = dll._handle + offset
decode = prototype(string_decoder_addr);

for (va, s) in strings:
    print(hex(va) + ' ' + s + ' -> ' + decode(s))

Simple, dimple. Paste the strings from IDA Pro into this script, ctypes loads and calls into the malware, and Bob's your uncle. For extra credit, you can update this script to emit another script that will create the appropriate comments or bookmarks in IDA Pro. This ctypes procedure works great for DLLs. Unfortunately, next time, it'll probably be an EXE and not a DLL. For those cases, you'll have to adapt this to a different tool, such as flare-dbg, to control malware execution and feed it the strings you want to decode. I'll talk more about tools and techniques for this another time.

Thursday, October 13, 2016

Script Kitties Early Trick or Treat, Part 2


I promised a treat. Well, as scripts go, this will probably be like the time you went trick-or-treating as a kid and the old couple gave you three pennies and then you walked down the street and realized the pennies seemed to smell bad, but hey, it's money you didn't have before, so what the hay. It's not quite that bad, it's just I wrote it in 2006 and I didn't do much to bring it into modern times. But, here we go...

In 2006, PowerShell was just about to be released and around the same time I was thinking, darn it, wouldn't it be easier to experiment with VBScript if they had given me a command line? So I made one.

As it turns out, some malware is written in VBScript, so this came in handy a while back for me to decode a few lazily "encoded" strings that were assembled using the VBScript Chr() function and string concatenation. It let me figure out what COM objects were being created and move on with my life, so maybe it'll be useful to you.

I also added the ability to switch to JScript, because people also write malware in JScript, so hell, why not.

Here's a little demo:

You're wishing I just gave you the pennies now, aren't you.

Yeah, that's it. If you look at the code, you'll find out why it stinks just like those pennies. But it serves its purpose. So, enjoy!

Here's the code: https://github.com/strictlymike/eval-hta

Wednesday, September 14, 2016

Script Kitties Early Trick or Treat, Part 1

Some of my old sysadmin tricks became useful again when I analyzed some malware targeting Windows Scripting Host (WSH). In this article I'll share a trick, and in the next, I'll share a treat.

When logic gets hairy, both developers and malware analysts open a debugger to get more information. But what can be done when the target platform is WSH? As it happens, there are debuggers for this, too, and they can be had by installing either Microsoft Office or Microsoft Visual Studio in your dynamic analysis VM. To invoke the debugger, use the /X switch of either cscript.exe or wscript.exe, e.g.:

wscript.exe /X rat3ie.vbs

Here's the Visual Studio debugger, halting on line 1 of a craptacular VBScript RAT:


This gives the ability to view local variables in the Locals tab (at bottom), set breakpoints, and step through code.

That's all for this little nugget. Next time, I'll post a tool I wrote in 2006 that came in handy for conveniently and interactively evaluating VBScript and JScript to de-obfuscate strings and experiment with malware functionality.

Tuesday, September 6, 2016

"Advanced" OllyDbg Scripting

Alternative possibilities:
  • I'm daft;
  • OllyDbg's "Warn when breakpoint is outside the code section" option can't (always?) be truly disabled in odbg110; or,
  • This is not the droid (i.e. option) that I'm looking for.
In any case:

Set sh = CreateObject("WScript.Shell")

While True
    Call sh.SendKeys("%Y")
    Call WScript.Sleep(100)
Wend

And goodbye to this dialog when attempting to find the OEP by tracing into:

Next episode, we answer the question: did OllyDump ever finish? ;-)

Edit 10/14/2016: It never finished, so I ended up doing it manually by catching the unpacker in a memcpy and dumping its payload from poi(esp+4). You live, you learn.

Monday, August 29, 2016

Process Monitoring for the Curious and Paranoid

It's been months since I had time for any of this, but I've been thinking for a long time about what I would discover if I were to monitor process creation with some sort of balloon notification. Between coming to bed late one night, some scraps of time here and there to document it, and a day home to polish it off while my sick daughter naps, here's a useful tool. I want to emphasize, it's hacky, but for a busy father's casual/opportunistic research, it's enough to play jazz.

Objective

I would like to expediently answer a few questions, including:
  • Is a new process the reason why my mouse pointer changed to the wait icon?
  • Was a new process responsible for my computer slowing down?
  • How often do new processes start, anyway?
  • What are some commonly executed processes that I haven't noticed yet?
  • Does this process run any sub-processes?
  • Is there any process associated with that pop-up, or is it an already-running process?
Poring over my event logs is the wrong answer because eventvwr is slow to pop up and navigate, so when I am experiencing slowness, it doesn't allow me to get up-to-the-moment answers. Also, it can be tedious and time consuming to go back and find the right event, and my boss doesn't pay me to stare at event logs. And then how do I know that this event occurred at the same time as the phenomenon I'm observing?

What I want is a way to casually take note of interesting process creation events throughout the day without really spending time on it.

Alternative Solutions

I've had a few options rolling around in my head for a while:
  • Instance creation event query on Win32_Process creation - Around 2005 I experimented with this and found that it cannot catch short-lived processes because they are created and destroyed between polling intervals which must last, at minimum, one second.
  • Win32_ProcessTrace - I started out with this, but alas, they do not contain full image name information, so I needed to query the OS for further information, and again, short-lived processes result in information loss.
  • Monitoring event logs - Event ID 4688 provides image names, but advanced configuration is required to obtain full command lines. Alternatively, SysInternals' Sysmon logs this information by default. WMI or other methods could be used to notify on event creation.
  • The Windows kernel exports PsSetCreateProcessNotifyRoutineEx, which provides access to a convenient PS_CREATE_INFO structure containing the full image name and command line. Alas, this requires either purchasing and protecting an expensive driver signing certificate, or leaving a kernel code execution vulnerability unpatched so as to inject a driver as described in the whitepaper I published in February.

Implementation

Unfortunately, mucking with drivers is not lazy enough for me. Since short-lived processes are important (they are commonly used as part of post-exploitation / recon), a Win32_Process instance creation query won't work. For ease of use, I've created a first draft solution by Frankensteining two C# StackOverflow answers together to use systray balloon notifications with WMI's Win32_ProcessTrace. I put this on the Internet so I could compile it and use it to see what was going on with my work computer.

Here's the gist of it

It's lazy, but for casual/opportunistic research, it's enough to play jazz. It doesn't capture command-line arguments and doesn't always capture the full image name, because it just uses Win32_ProcessTrace and then the .NET System.Diagnostics classes to get process information after the fact.

Alas, it bothers me not to have full image names or command-line arguments. The best source of information I know of in userspace is event logs, but I had trouble getting the info I needed on advanced logging configuration for my Windows 8.1 box, I just installed Sysmon. Now what?

Another gist

As it turns out, it is necessary to modify the registry and restart the Windows Management Instrumentation service (and its dependent services) to make this work. I added a Microsoft-Windows-Sysmon/Operational key to HKLM\SYSTEM\CurrentControlSet\Services\EventLog and restarted the winmgmt service, and it all came together.

This gist has a detailed console view along with the systray notification to prevent me from having to necessarily open eventvwr to see more details. Here's how it looks:


Observations

Here are a few startling events and associated discoveries sure to send a chill down your spine, all from tracking down process activity during my journey:
  • netsh.exe just ran. Is this some post-exploitation alteration of my firewall rules? No, a certain VPN client executes netsh.exe to get its work done. This was not the only software I caught doing that.
  • Windows Remote Assistance COM Server (raserver.exe) executed and terminated immediately. What interfaces does this provide? Could this be post-exploitation enabling of remote assistance for future access? No. It's a scheduled task that triggers upon group policy updates so remote assistance knows to update its configuration.
  • reg.exe just got run by cmd.exe. Holy schnikes, now I'm truly pwned. Is the parent process a backdoor executing persistence or other post-exploitation commands? Nope. It's just some endpoint management software that IT confirms they deploy and manage.
  • Added 9/7/16: Heart rate increases as I read C:\Windows\system32\rundll32.exe C:\Windows\system32\inetcpl.cpl,ClearMyTracksByProcess Flags:525568 WinX:0 WinY:0 IEFrame:0000000000000000. Then I remember I just closed an IE in-private window. Take a look at the parent process command line and see: "C:\Program Files\Internet Explorer\IEXPLORE.EXE" -private. WHEW!

Value

So, as you can see, sometimes situational awareness is not all it's cracked up to be! As most DFIR people and hunters are aware, there is plenty of noise just sitting there waiting to alarm you.

Even so, I think this tool could be useful for noticing anomalous process observables such as:

This tool can increase your awareness of what applications are responsible for certain behaviors, such as the Get Windows 10 user prompts that everybody loved so much. It can also raise your awareness of cases where security policies do not appear to be doing their job, such as application whitelisting. If you're a paranoid or curious power user, this may all be useful to you. In case it is, here are those gists again:
If I polish this up into something nicer, I'll try to update this article with the link.