Wednesday, October 4, 2017

Free Shortcuts in IDA Pro

I'm tired of reassigning everything to the same hotkey in IDA Pro because I don't know which hotkeys are free. Here are the IDA Pro keyboard shortcuts I know of that aren't in use in IDA Pro so far. Only one- and two-key shortcuts are included. I have omitted shortcuts used by BinDiff and flare-ida, because I don't want to collide with those.

  • ` (backtick)
  • , (comma)
  • <>{}[] (left and right angle bracket, brace, and square bracket)
  • Most (but not all) of the top row: !@#$%^&*()+=
  • I
  • J
  • Alt+F4,F5, and F8
  • Alt+E, F, N, O, U, V, W, Z
  • Ctrl+0, 4, 5, 7, 8, 9
  • Ctrl+H
  • Ctrl+Y
  • Shift+A-C
  • Shift+F-O
  • Shift+Q
  • Shift+S-Z
I got these by visiting Options -> Shortcuts... in a recent version of IDA Pro. If you notice any others, or notable collisions, please comment or message and I will update.

Thursday, September 28, 2017

Two Great Tastes: IDA + WinDbg

Setting up remote debugging with IDA+WinDbg can be difficult when it doesn't work right off the bat, because the errors don't jog the right thought process for you to fix the setup and get it working. This causes some people to walk away from the whole thing, which is unfortunate. This setup is SOOOOO useful that it's worth slogging through the pain to get it working. The value of having graph view and IDA's annotation capabilities on-hand while debugging cannot be overstated.

Here, I'll emphasize one thing that could stand to be better emphasized in Hex-Rays' own documentation: you have to be using the same version of WinDbg on each side. And I'll indicate some ways to isolate end-to-end (E2E) issues. Note that the system with IDA Pro on it is referred to here as the analysis system (it's where you do your analysis of the code), and the system where you run malware is referred to as the target system.

Pointers

  • Resolve any end-to-end (E2E) issues first (firewalls, networking, etc.)
  • Lock IDA Pro into using the same version of WinDbg as is on your target system
  • Use WinDbg itself to verify that there are no E2E issues

Algorithm

This is exactly how to set up a remote debugging setup with IDA Pro and WinDbg. Here are the steps:
  1. Both systems: Ensure your analysis and target machines can access each other over the network
    1. If they are VMs, you may need to adjust them to ensure they are both host-only
    2. You might need to mess with firewall settings
    3. If you are using FakeNet-NG, you might need to add an exception for dbgsrv.exe
  2. Target system: Locate (install, if necessary) WinDbg on your target system.
  3. Target -> Analysis system: If you haven't installed the same version of WinDbg to both systems, then simply copy the entire x86 directory where you located WinDbg on the target system, onto your analysis system. It doesn't matter where you place this.
  4. Analysis system: Edit ida.cfg to set DBGTOOLS to point to the x86 directory
    1. Use double backslashes, e.g. DBGTOOLS = "C:\\Program Files (x86)\\Windows Kits\\10\\Debuggers\\x86\\";
  5. Target system: Start the WinDbg debug server
    1. "C:\path\to\dbgsrv.exe" -t tcp:port=9999
  6. Analysis system: Test by trying to connect remotely with WinDbg itself - if this doesn't work, then you've got end-to-end issues to resolve before IDA will work
  7. Analysis system: configure your IDB to use WinDbg:
    1. Debugger -> Switch debugger... (select Windbg debugger and click OK)
    2. Debugger -> Options...
      1. Application: path\on\your\target\system\to\binary.exe
      2. Input file: path\on\your\target\system\to\binary.exe
      3. Directory: path\on\your\target\system\to
      4. Parameters: command-line arguments you want passed to the malware (if any)
      5. Connection string: tcp:server=TARGETSYSTEMNAME,port=9999
      6. Click OK 
  8. Analysis system: Click on an instruction and hit F4 to "run to" that instruction, or set a breakpoint and strike F9
  9. Disregard warnings as applicable ;-)

Troubleshooting

You may want to audit your user and system PATH environment variables to ensure that they don't include the x86 directory of a conflicting version of WinDbg, or the x64 directory for that matter.

If you get "Could not initialize WinDbg engine 0x7f / The specified procedure could not be found... You might try adding the path to that x86 directory to your system path and closing/reopening IDA. I also find that certain Python scripts seem to cause IDA Pro to emit this error, so you might also try closing/reopening IDA, initiating your debug session, and only THEN loading any ancillary IDAPython scripts you were using.

Miscellany

As of 2011, Hex-Rays indicated that this would not work with the x64 tools.

Saturday, August 19, 2017

Done to Death

I saw this tweet from @redteamwrangler today:


This question is a pretty easy fallback for interviewers and it might be getting a little old for us. But it set me to thinking about how tediously I could answer this without using the Internet or any reference materials on my machine. Some of these details might be a little off or just downright wrong, but I'll display my ignorance. It was a fun exercise since it isn't in the context of any actual interview :-)

What happens when you type www.google.com into a browser and press return? Supposing you're using Internet Explorer for Windows on an wired (Ethernet) connection:

  • 8259a or emulated 8259a keyboard controller emits some scancodes
  • Keyboard interrupt is sent to the CPU
  • Interrupt service routine acknowledges interrupt, potentially moves one or more scancodes into a buffer
  • Or a delayed procedure call (DPC) does
  • ntoskrnl/win32k determine which thread corresponds to the foreground window and deliver a series of window messages of type WM_KEYDOWN/WM_KEYUP ending with one having virtual key code VK_ENTER
  • Window procedure for the browser URL bar (which is a window object) is called with a window message of type WM_KEYUP with virtual key code VK_ENTER
  • Window procedure has a switch statement / jmp table in it that accounts for this particular window message (WM_KEYUP) and maybe a sub-case for VK_ENTER
  • Probably takes the accumulated buffer so far (L"www.google.com") and passes it to a function
  • Probably uses a library like WinInet to do the real stuff
    • Probably calls InternetOpen() to get a handle of type HINTERNET
    • Probably calls InternetOpenUrlW() or HttpSomethingSomething() to get another HINTERNET handle
      • Probably reads the registry or uses a cached value for the HTTP User-Agent field that it provides here
      • Probably uses WinSock2 for TCP
      • Probably calls ws2_32!WSAStartup() if it hasn't been called yet
      • Checks proxy settings for the user and optionally establishes a connection with the corresponding hostname and implements HTTP proxy requests instead of direct HTTP requests
      • Parses the URL for the hostname, protocol scheme, any explicit port specification, URI, query parameters, etc.
        • Probably uses urlmon!InternetCrackUrlW() for this (or is that in wininet? I think it's in urlmon)
        • If no protocol scheme is specified, uses http:// which has a default port of 80
        • If https:// is specified, a default port of 443
      • Issues a DNS A (IPv4 address) request and/or AAAA (IPv6 address) request for the name
        • Probably calls ws2_32!gethostbyname() to do this
          • Thread consults DNS resolver cache service (if running) for name, probably via IPC
            • DNS resolver cache either returns the name or...
            • Probably uses dnsapi.dll which exports some function that...
              • Checks DNS configuration (probably the registry) to get primary, secondary, tertiary, etc. DNS servers
              • Calls ws2_32!inet_aton() to convert human-readable configuration to IPv4 or IPv6 addresses
              • Creates a socket object via ws2_32!socket()
              • Creates an in_addr object to communicate with the DNS server
              • Uses ws2_32!sendto() to use AF_INET/IPPROTO_UDP connectionlessly querying the server
                • Network layer (hmm, getting hand wavy) consults routing table to determine what interface packet should go through and whether it must visit a gateway
                • Network card device driver creates and fills out an object that the kernel uses to describe network datagrams (packets)
                • Network card device driver initiates I/O request with NIC via PCI registers or other hardware interface to provide datagram to be transmitted
                  • NIC takes the medium and transmits Ethernet frames bearing the octets that were given to it
                  • If another host transmits at the same time, the two hosts use the binary exponential backoff algorithm to wait until the medium is clear
                  • A router is likely the gateway; it accepts the packets and creates new packets to send across one or more other networks until the DNS server receives them
                  • DNS server UDP stack handles incoming packet, provides it to UDP-based DNS service e.g. bind which is bound to port 53
                  • Bind parses the packets, potentially forwards the request if the desired names are not in its zone file, and returns the response
              • The DNS resolver cache service receives and parses DNS reply/replies and returns the answer to the DNS client
          • If the DNS resolver cache service wasn't running, ws2_32!gethostbyname() probably does most of this itself
      • Since you only typed "www.google.com", it's plaintext HTTP on the default port, so 80
      • Establishes a TCP connection with the resulting host number and port
        • ws2_32!socket() to get a socket object
        • ws2_32!connect() with AF_INET and IPPROTO_TCP to connect
          • tcpip.sys is probably involved here
          • Again the network card and Ethernet medium stuff
          • TCP three-way handshake, window negotiation, etc.
            • The client sends a SYN TCP segment
            • The server returns a SYN,ACK TCP segment
            • The client returns an ACK TCP segment
          • TCP data transmission
            • The client sends a SYN,PSH TCP segment pushing data
            • Something like "GET / HTTP/1.1\nHost: www.google.com\nUser-Agent: ..."
  • Google's web server does some thinking and returns a response
  • The client receives a 3xx redirect response and gets directed to go to https://www.google.com/
  • Uses Microsoft schannel (secure channel) library to negotiate ciphers, parse the server's security certificate, and transmit data over TLS
  • Starts with ClientHello message, ServerHello, etc.
  • Obtains HTTP response, something like "HTTP 200 OK\n..." with some HTML in the HTTP body
  • HTML links to images, maybe JavaScript, etc., resulting in Cross-Origin (CORS) processing and follow-on requests
  • Invokes the JScript scripting engine for JScript and rendering engine to display the content
  • Uses graphics primitives and likely renders into a buffer that it furnishes to win32k.sys through GDI calls
  • GDI manages framebuffer of all windows including the foreground window
  • Monitor dispays the framebuffer
  • Photons fly into your eyes
  • Optic nerve and brain adjust for upside-down image arriving at retina
  • Person realizes then went to Google and says, "crap, I meant to go to Bing." Orrrrrr maybe not, haha.

If I had more time, I'd draw this out a little more, but I had to quit eventually. And the more I do this, the more I bump into all the things I don't know. A couple things I'd like to know more about:

  • What does "network layer" mean on Windows? I could use ETW with syscall stackwalking enabled to follow the ws2_32!connect() call into the kernel, or Windows Internals might just tell me.
  • What kernel object represents a packet in the Windows kernel? A packet buffer? I forgot :-( 
  • How does the networking stack give a packet to the NIC to transmit it? My device driver fu is ageing.


Sunday, April 23, 2017

So, de beency bouncy burger, eh?


A colleague found this decoder called CyberChef, which I wish to bookmark and share with you. You may find it useful, too. I hear it can be downloaded as a standalone web page if you wish to audit it and then use it privately for opsec reasons, offline analysis, etc.


Børk, børk, børk!

Truthful ProgrammEEng

In this article I'll share how to approach complex logic problems by borrowing from the Electrical Engineering (EE) discipline. I'll discuss how I've used techniques from digital logic circuit design to write efficient and accurate code for hypervisor startup and for packet redirection.

This approach can reduce unnecessary nested/multiple conditional statements down to a one-liner. It applies to software engineering scenarios when you can express your problem in terms of a set of strictly Boolean (true/false) conditions.

If you find yourself contemplating a tangled web of conditional (if/else) code or you find it difficult to understand what conditions contribute to the decision you want your software to make, take a step back and consider applying this technique from digital logic circuit design. If nothing else, the first three or five steps will get you on the right track to write the correct conditional logic (in if/else style) to solve your problem. If you can carry this process to its conclusion, then you can arrive at the most optimized one-liner to solve your logic problem.

It consists of the following steps:
  1. Figure out what Boolean (true/false) conditions are necessary to the decision at hand
  2. Define a truth table that specifies all the possible conditions
  3. Mark which conditions you want to yield in a TRUE result
  4. Turn the TRUE cases (EEs call these minterms) into logical expressions
  5. Logical-OR those expressions together to render a decision (EEs call this the canonical sum-of-products, or CSOP, logic function)
  6. Simplify if possible

Here's a hypervisor programming example followed by a network filtering example to demonstrate the process.

Starting a VT-x Hypervisor


I needed to write startup code for a tiny hypervisor project using Intel Virtualization Technology Extensions (VT-x). I knew nothing about VT-x, but I did know that Intel documented the corresponding VMX instruction set and all its requirements in their processor manual, so I started there. Most of the publicly available code I could get my hands on seemed to specifically check one-off control flags to check if it was okay to enter VMX root operation, ignoring the exact specifications that Intel provided in more modern documentation. I decided to implement my own check based on the data sheet.

The Intel manual describes some requirements for control registers CR0 and CR4 to allow the VMXON instruction to work. Here is some not-very-succinct text from the Intel manual (in case this makes your eyes bleed, I'll provide a more succinct summary next):

Clear as mud.

In summary, there is a FIXED0 and a FIXED1 model-specific register (MSR) for CR0, and another pair of these for CR4. The most important part of the text above is the last sentence starting with "Thus, each bit...". This amounts to the following possible values of FIXED0:FIXED1 along with their corresponding meaning:


F0F1CR must be
00fixed to 0
11fixed to 1
01don't care

Notice that one case is missing from Intel's description: $F0:F1 = 10$. When we create a truth table including $CR$ as an input, this will amount to two missing / don't-care cases (one for $CR=0$ and another for $CR=1$).

So, expanding this out to take into account the two possible values of any bit in the control register we are checking, we have the following truth table for the possible values of $F0:F1$ and $CR$:


F0F1CRInvalid
000FALSE
001TRUE (control register bit should be 0 but is 1)
110TRUE (control register bit should be 1 but is 0)
111FALSE
010FALSE
011FALSE

Since there are two cases where a given control register bit can be in an invalid state, that means there are two logical cases, or minterms, either of which should result in a verdict of true (i.e. it is true that the control register is in an invalid state). Here's the same table from above, but formatted a little bit more like a truth table, with minterms called out.


F0F1CRInvalidMinterms
0000
0011$\overline{F0}\cdot\overline{F1}\cdot CR$
1101$F0 \cdot F1 \cdot \overline{CR}$
1110
0100
0110

This amounts to the following sum of products logic function:

$$Invalid(F0,F1,CR)=\overline{F0} \cdot \overline{F1} \cdot CR+F0 \cdot F1 \cdot \overline{CR}$$

Boolean algebra tells us that what is true for one bit in a bit vector is true for all bits. So, in C code, each negated variable (e.g. $\overline{F0}$) amounts to inverting all the bits in the integer. So, the C code for this would look like:


int is_invalid(int fixed0, int fixed1, int cr)
{
    return ((~fixed0 & ~fixed1 & cr) | (fixed0 & fixed1 & ~cr));
}

Boolean algebraic simplification can be applied to optimize this function to result in fewer logical operators, and fewer instruction opcodes emitted by the compiler. Optimization is left as an exercise for the student (hint: XOR is involved) ;-)

Redirecting Network Traffic


More recently, I've been writing logic for the Linux Diverter in FakeNet-NG. This project is the successor to the original FakeNet tool distributed by Siko and Tank to let people simulate a network in a single virtual machine. The NG version was originally developed to make it possible to use FakeNet on newer versions of Windows, but it would be nice for it to work on Linux, too.

So, I am writing a Linux "Diverter", which is a component that manages how packets are redirected and manipulated to simulate the network. This is a really fun project in which I'm using python-netfilterqueue to catch and redirect packets so we can observe traffic sent to any port in the system, even ports where no service is currently bound.

The specification for the Linux Diverter includes redirecting traffic sent to unbound ports into a single listener (similar to the INetSim dummy listener). We want the Linux version of FakeNet-NG to be used in two modes:
  • SingleHost: the malware and the network simulation tool are running on the same machine, like the legacy version of FakeNet.
  • MultiHost: the malware and the network simulation tool are running on different machines, like INetSim.
The conditions for whether a packet must be redirected boil down to a logic function of four inputs:

  • (A) Is the source address local?
  • (B) Is the destination address local?
  • (C) Is the source port bound by a FakeNet-NG listener?
  • (D) Is the destination port bound by a FakeNet-NG listener?

The criteria for changing the destination port of a packet are as follows:
  1. When using FakeNet-NG in MultiHost mode (like INetSim), if a foreign host is trying to talk to us or any other host, ensure that unbound ports get redirected to a listener.
  2. When using FakeNet-NG in SingleHost mode (like legacy FakeNet), ensure outbound destination packets are redirected except when the packet is a response from a FakeNet-NG listener (in other words, the packet originated from a bound port).
The truth table for a decision function that redirects traffic destined for local, unbound ports to a single dummy listener in both SingleHost and MultiHost scenarios is as follows, with local IPs and bound ports in bold:


Sixteen cases

Here, we translated all the different human-comprehensible conditions like "it's coming from a foreign host, don't care what port, and it's arriving at the local host to an unbound port" into a set of Boolean conditions that can be either true (1) or false (0). It's convenient to use letters like A, B, C, and D to represent the inputs (see the first row of the table above). The minterms of this function are the cases when it returns true, namely:


  1. $\overline{A} \cdot \overline{B} \cdot \overline{C} \cdot \overline{D}$
  2. $\overline{A} \cdot \overline{B} \cdot C \cdot \overline{D}$
  3. $\overline{A} \cdot B \cdot \overline{C} \cdot \overline{D}$
  4. $\overline{A} \cdot B \cdot C \cdot \overline{D}$
  5. $A \cdot \overline{B} \cdot \overline{C} \cdot \overline{D}$
  6. $A \cdot B \cdot \overline{C} \cdot \overline{D}$

We can see that a few terms can be simplified, such as (1) and (2). Since A, B, and D are false and C can be either true or false, these two really amount to A' B' D'. We can do this to arrive at a fairly simple function of these three disjunctive terms:


  • $\overline{A} \cdot \overline{B} \cdot \overline{D}$
  • $\overline{A} \cdot B \cdot \overline{D}$
  • $A \cdot \overline{C} \cdot \overline{D}$
From there, you can just get rid of B and collapse the first two cases into one:

  • $\overline{A} \cdot \overline{D}$
  • $A \cdot \overline{C} \cdot \overline{D}$
And from there, you can take one step further by looking more closely at the truth table to find the optimal logic. But there are six minterms here, so it might be time to bust out a more powerful tool: the ol' Karnaugh map. A K-map allows you to visually locate all the adjacent groups (pairs, quads, etc.) of logical "yes" outputs and arrive at the simplest possible logic function to yield the desired output. If you're not familiar, you should definitely check this out.

Here's the K-map for our logic function:


Short and sweet: two disjunctive terms in three variables

The K-map here has only two groups of adjacent minterms: those that occur when $A$ and $D$ are zero, and those that occur when $C$ and $D$ are zero. This results in two disjunctive terms, each requiring only two input variables apiece (three in total):
  • $\overline{A} \cdot \overline{D}$
  • $\overline{C} \cdot \overline{D}$
So, the minimal sum of products logic function would be:

$$R(A, B, C, D) = \overline{A}\overline{D}+\overline{C}\overline{D}$$
Or, in Python:


        return ((not src_local and not dport_bound) or
                (not sport_bound and not dport_bound))


Done and done.


The next time you find yourself rolling around in freaky nested conditionals and arriving at the wrong logic, try approaching it the way an electrical engineer would: express the problem in terms of a set of Boolean conditions and then figure out how you want each case to go. If you want the simplest result, you can use Boolean algebra or learn to use a K-map to handle the rest. But even if you stop at the truth table, at least this process will help you sort out logic that you might otherwise be confused about and ensure that you know all the test cases you'll need to include to properly test your code.

MathJax

I fixed MathJax for mobile on my blog. I also made it retrieve the scripts via cloudflare over https rather than in the plain from mathjax.org, in case any of my readers live in repressive regimes that punish people for reading beautifully rendered equations.

This might be useful to other blogger.commers who like LaTeX/MathJax and want to see it render on the mobile version of their blog:
http://stackoverflow.com/questions/42592013/blog-with-mathjax-seen-on-a-cellphone

Okay. Carry on.

Saturday, April 22, 2017

Chasing Heisenbugs: Troubleshooting Frustratingly Unresponsive Systems

I did some work in January 2016 on automated performance profiling and diagnosis. As @arvanaghi pointed out, this can be useful for investigating observables resulting from potentially malicious activity. So, I'm figuring out where I left off by turning my documentation into a blog post. What I wrote is pretty stuffy, but since I am sharing it in blog format, I will take some artistic license here and there. Without further ado, I present to you:

I'm just going to paste the whole thing here and draw emoticons on it

Scope

Several challenges make performance profiling and diagnosis of deployed applications a difficult task:
  • Difficulty reproducing intermittent issues
  • Investigation inhibited by user interface latency (UI) due to resource consumption
  • Unavailability of appropriate diagnostic tools on user machines
  • Inability of laypeople to execute technically detailed diagnostic tasks
  • Unavailability of live artifacts in cases of dead memory dump analysis
My studies have included two following types of disruptive resource utilization:
  • User interface latency due to prolonged high CPU utilization
  • User interface latency due to prolonged high I/O utilization
I'll just be talking about CPU here.

Where applicable, this article will primarily discuss automated means for solving the above problems. Tools can be configured to trigger only when issues appear that are specific to the software and issues that the diagnostic software is meant to address. Where feasible, I will share partial software specifications, rapidly prototyped proofs of concept (PoCs), empirical results, and discussion of considerations relevant to production environments.

Prolonged High CPU Utilization

Automated diagnostics in general can be divided into two classes: (1) those that are meant to identify conditions of interest (e.g. high CPU utilization); and (2) those that are meant to collect diagnostic information relevant to that condition. Each is treated subsequently.

Identifying Conditions of Interest

For purposes of this discussion, two classes of CPU utilization will be used: single-CPU percent utilization and system-wide percent CPU utilization. Single-CPU percent utilization is defined to be the percent time spent in both user and kernel mode (Equation 1); system-wide CPU utilization is defined to be the same figure, divided by the  number of CPUs in the system (Equation 2). For example, if a process uses 100% of a single logical CPU in a four-CPU system, its system-wide CPU utilization is 25%. System-wide CPU utilization is the figure that is displayed by applications such as taskmgr.exe and tasklist.exe.

$$u_1=\frac{\Delta t_{user} + \Delta t_{kernel}}{\Delta t}$$
(Eq. 1)

$$u_2=\frac{u_1}{n_{cpus}}$$
(Eq. 2)

High CPU utilization can now be defined from the perspective of user experience. Single-threaded applications will only be capable of consuming <100% of the CPU time on a single CPU (e.g. on a two-CPU system, <50% of system CPU resources). Multi-threaded applications have a much higher potential impact on whole-system CPU utilization because they can create enough CPU-intensive threads to run all logical CPUs at 100%. For purposes of this article, 85% CPU system-wide CPU utilization or greater will constitute high CPU utilization.

As for prolonged high CPU utilization, that is a subjective matter. From a user experience perspective, this can vary depending upon the user. For purposes of this article, high CPU utilization lasting 5 seconds or greater will be considered to be prolonged high CPU utilization. In practice, engineers might also need to consider how to classify and measure spikes in CPU utilization that occur frequently but for a shorter time than might constitute "prolonged" high CPU utilization; however, these considerations are left out of the scope of this article.

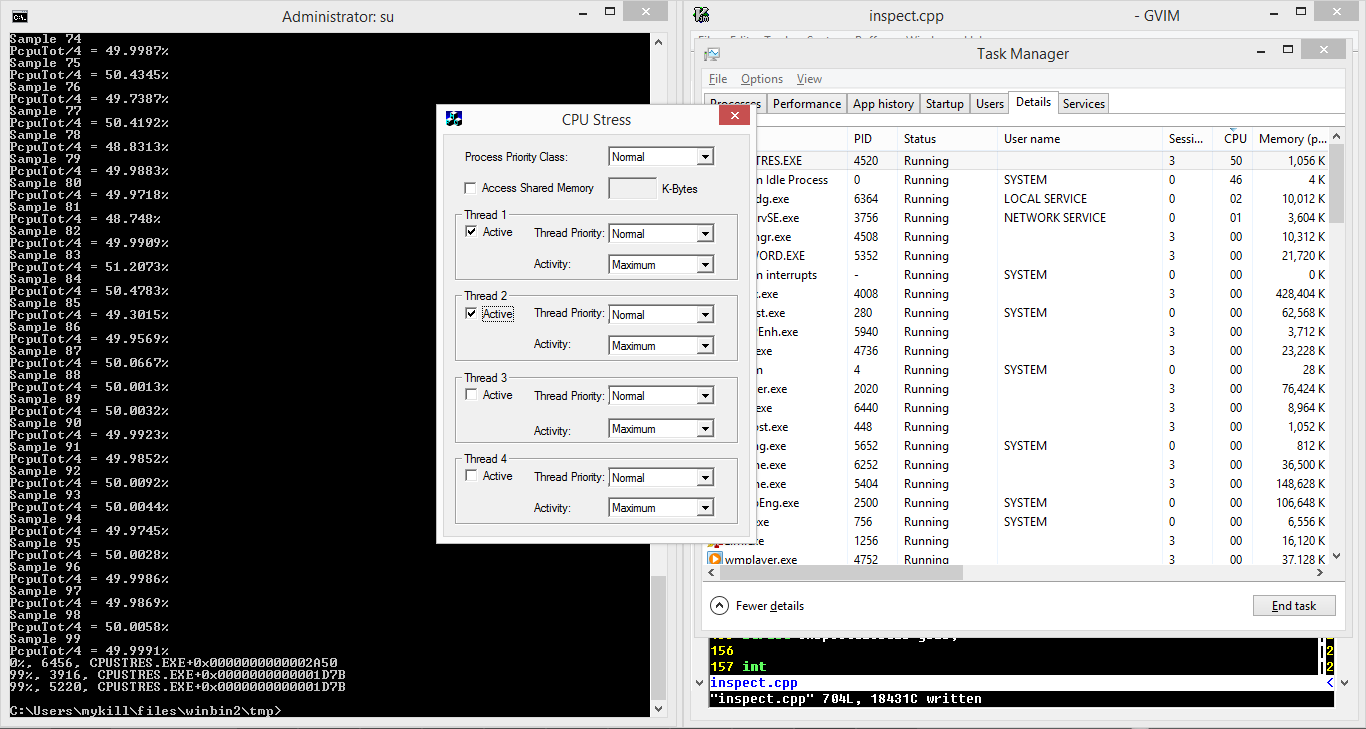
I've implemented a Windows PoC (trigger.cpp) to assess the percent CPU utilization (both single-CPU and system-wide) for a given process. I don't know of any APIs for process-wide or thread-specific CPU utilization, but Windows does expose the GetProcessTimes() API which can be used to determine how much time a process or thread has spent executing in user and kernel space over its life. I've used this to measure the change in kernel and user execution times versus the progression of real time as measured using the combination of the QueryPerformanceCounter() and QueryPerformanceFrequency() functions. Figure 1 shows the PoC in operation providing processor utilization updates that closely track the output of Windows Task Manager. The legacy SysInternals' CPUSTRES.EXE tool was used to exercise the PoC.

Fig. 1: CPU utilization tool

There's one more thing to think about. If a diagnostic utility is executed indefinitely, it would be nice to make it consolidate successive distinct CPU utilization events into a single diagnostic event.

For example, the CPU utilization graph in Figure 1 below depicts a single high-CPU event lasting from $t=50s$ through $t=170s$. Although there are two dips in utilization around $t=110s$ and $t=150s$, this would likely be considered a single high-CPU event from both an engineering and a user experience perspective. Therefore, rather than terminating and restarting monitoring to record two events, a more coherent view might be obtained by recording a single event.

Fig. 2: Single high CPU utilization event with two short dips

A dip in utilization might also represent a transition from one phase of high CPU utilization to another, in which the target process performs markedly different activities than prior to the dip. This information can be preserved within a single diagnostic event for later identification provided that sufficiently robust data are collected.

One way to prevent continual collection of instantaneous events and to coalesce temporally connected events together is to define a finite state machine that implements hysteresis. Thresholds can be defined and adhered to in order to satisfy both the definition of "prolonged" high CPU utilization and the requirement that diagnostic information is not collected multiple times for a single "event". Such a state machine could facilitate a delay before diagnostics are terminated and launched again, which can in turn prevent the processing, storage, and/or transmission of excessive diagnostic reports representing a single event. Figure 3 depicts a finite state machine (FSM) for determining when to initiate and terminate diagnostic information collection.

Fig. 3: It's an FSM. Barely.

The state machine in Figure 3 above would be evaluated every time diagnostic information is sampled, and would operate as follows:
  1. The machine begins in the Normal state.
  2. Normal state is promoted to High CPU at any iteration when CPU utilization exceeds the threshold (85% for purposes of this article).
  3. When the state is High CPU, it can advance to Diagnosis or regress to Normal, as follows:
    1. If CPU utilization returns below a threshold before the threshold number of seconds have elapsed, then this does not qualify as a "prolonged" high CPU utilization event, and state is demoted to Normal;
    2. If CPU utilization remains above the threshold utilization value for the threshold number of seconds, then diagnostics are initiated and state is promoted to Diagnosis.
  4. The Diagnosis state is used in combination with the Normal-Wait state to avoid continually repeating the diagnostic process over short periods. When the state is Diagnosis, it can either advance to Normal-Wait, or remain at Diagnosis. The condition for advancing to Normal-Wait is realized when CPU utilization for the target process falls below the threshold value.
  5. When the state is Normal-Wait, the next transition can be either a regression to Diagnosis, no change, or an advance back to the Normal state:
    1. If the CPU utilization of the target process returns to high utilization before the time threshold expires, the threshold is reset and the state regresses to Diagnosis. In this case, diagnostic information collection continues.
    2. If CPU utilization remains low but the threshold duration has not elapsed, the state machine remain in Normal-Wait.
    3. If the CPU utilization of the target process remains below the threshold value for the threshold duration, then diagnostics are terminated, the state transitions back to Normal, and the machine can return to a state in which it may again consider escalating to further diagnostics of subsequent events.
The accuracy of this machine in identifying the correct conditions to initiate and terminate diagnostic information collection could be improved by incorporating fuzzy evaluation of application conditions, such as by using a moving average of CPU utilization or by omitting statistical outliers from evaluation. Other definitions, thresholds, and behaviors described above may be refined further depending upon the specific scenario. Such refinements are beyond the scope of this brief study.

Collecting Diagnostic Information

When prolonged high CPU utilization occurs, the high-level question on the user's mind is: WHAT THE HECK IS MY COMPUTER DOINGGGGGG????!!

And to answer this question, we can investigate where the application is spending its time. Which, incidentally, is available to us through exposed OS APIs.

To address where the application is spending its time, two pieces of information are relevant:
  1. What threads are consuming the greatest degree of CPU resources, and
  2. What instructions are being executed in each thread?
This information may allow engineers to identify which threads and subroutines or basic blocks are consuming the most significant CPU resources. In order to obtain this information, an automated diagnostic application must first enumerate and identify running threads. Because threads may be created and destroyed at any time, the diagnostic application must continually obtain the list of threads and then collect CPU utilization and instruction pointer values per thread. The result may be that threads appear and disappear throughout the timeline of the diagnostic data.

Ideally, output would be to a binary or XML file that could be loaded into a user interface for coherent display and browsing of data. In this study and the associated PoC, information will be collected over a fixed number of iterations (i.e. 100 samples) and displayed on the console before terminating.

For purposes of better understanding the origin of each thread, it can be useful to obtain module information and determine whether the thread entry point falls within the base and end address of any module. If it does, then slightly more informational name information, such as modname.dll+0xNNNN, can be displayed. Note that I said slightly more informational. Sometimes this just points to a C runtime thread start stub. But it's still worth having.

In the PoC, data is displayed by sorting the application's threads by percent utilization and displaying the most significant offenders last. Figure 4 shows threads from a legacy SysInternals CPU load simulation tool, CPUSTRES.EXE, sorted in order of CPU utilization.

Fig. 4: Threads sorted in ascending order of CPU utilization

Although this answers the high-level question of what the program is doing (i.e., executing the thread whose start routine is located at CPUSTRES.EXE+0x1D7B in two separate threads), it does not indicate specifically what part of each routine is executing at a given time.

To answer more specific questions about performance, two techniques are available:
  • Execution tracing
  • Instruction pointer sampling
Execution tracing can be implemented to observe detailed instruction execution by using either single-stepping via Windows debug APIs or by making use of processor-specific tracing facilities. Instruction pointer sampling on the other hand can be implemented quickly, albeit at a cost to diagnostic detail. Even so, this method offers improved performance since single-stepping is ssssllllloooowwwwwwwwwwww.

This PoC (inspect.cpp) implements instruction pointer sampling by suspending each thread with the SuspendThread() function and obtaining the control portion of the associated thread context via the GetThreadContext() function. Figure 5 depicts the PoC enumerating instruction pointers for several threads within taskmgr.exe. Notably, thread 3996 is executing a different instruction in sample 7 than it is in sample 8, whereas most threads in the output remain at the same instruction pointer across various samples, perhaps waiting on blocking Windows API calls.

Fig. 5: Instruction pointer for thread 3996

This information can provide limited additional context as to what the application is doing. More useful information might include a stack trace (provided frame pointers are not omitted for anti-reverse engineering or optimization reasons).

Conclusion

It's nice to be able to identify and collect information about events like this. But CPU utilization is only one part of the problem, and there are other ways of detecting UI latency than measuring per-process statistics. Also, what of inherent instrumentation available for collecting diagnostic information? What of kernrate, which was mentioned in Windows Internals book and is covered here. It looks as if this can be used instead of custom diagnostics, as long as there are sufficient CPU resources to launch it (either via starting a new process or by invoking the APIs that it uses to initiate logging). Would kernrate.exe (or the underlying APIs) suffer too much resource starvation to be useful in the automatically detected conditions I outlined above? In addition to this, what ETW information might give us a better glimpse into what is happening when a system becomes frustratingly unresponsive?

These are the questions I want to dig into to arrive at a fully automated system for pinpointing the reasons slowness and arriving at human-readable explanations for what is happening.