Wednesday, September 14, 2016

Script Kitties Early Trick or Treat, Part 1

Some of my old sysadmin tricks became useful again when I analyzed some malware targeting Windows Scripting Host (WSH). In this article I'll share a trick, and in the next, I'll share a treat.

When logic gets hairy, both developers and malware analysts open a debugger to get more information. But what can be done when the target platform is WSH? As it happens, there are debuggers for this, too, and they can be had by installing either Microsoft Office or Microsoft Visual Studio in your dynamic analysis VM. To invoke the debugger, use the /X switch of either cscript.exe or wscript.exe, e.g.:

wscript.exe /X rat3ie.vbs

Here's the Visual Studio debugger, halting on line 1 of a craptacular VBScript RAT:


This gives the ability to view local variables in the Locals tab (at bottom), set breakpoints, and step through code.

That's all for this little nugget. Next time, I'll post a tool I wrote in 2006 that came in handy for conveniently and interactively evaluating VBScript and JScript to de-obfuscate strings and experiment with malware functionality.

Tuesday, September 6, 2016

"Advanced" OllyDbg Scripting

Alternative possibilities:
  • I'm daft;
  • OllyDbg's "Warn when breakpoint is outside the code section" option can't (always?) be truly disabled in odbg110; or,
  • This is not the droid (i.e. option) that I'm looking for.
In any case:

Set sh = CreateObject("WScript.Shell")

While True
    Call sh.SendKeys("%Y")
    Call WScript.Sleep(100)
Wend

And goodbye to this dialog when attempting to find the OEP by tracing into:

Next episode, we answer the question: did OllyDump ever finish? ;-)

Edit 10/14/2016: It never finished, so I ended up doing it manually by catching the unpacker in a memcpy and dumping its payload from poi(esp+4). You live, you learn.

Monday, August 29, 2016

Process Monitoring for the Curious and Paranoid

It's been months since I had time for any of this, but I've been thinking for a long time about what I would discover if I were to monitor process creation with some sort of balloon notification. Between coming to bed late one night, some scraps of time here and there to document it, and a day home to polish it off while my sick daughter naps, here's a useful tool. I want to emphasize, it's hacky, but for a busy father's casual/opportunistic research, it's enough to play jazz.

Objective

I would like to expediently answer a few questions, including:
  • Is a new process the reason why my mouse pointer changed to the wait icon?
  • Was a new process responsible for my computer slowing down?
  • How often do new processes start, anyway?
  • What are some commonly executed processes that I haven't noticed yet?
  • Does this process run any sub-processes?
  • Is there any process associated with that pop-up, or is it an already-running process?
Poring over my event logs is the wrong answer because eventvwr is slow to pop up and navigate, so when I am experiencing slowness, it doesn't allow me to get up-to-the-moment answers. Also, it can be tedious and time consuming to go back and find the right event, and my boss doesn't pay me to stare at event logs. And then how do I know that this event occurred at the same time as the phenomenon I'm observing?

What I want is a way to casually take note of interesting process creation events throughout the day without really spending time on it.

Alternative Solutions

I've had a few options rolling around in my head for a while:
  • Instance creation event query on Win32_Process creation - Around 2005 I experimented with this and found that it cannot catch short-lived processes because they are created and destroyed between polling intervals which must last, at minimum, one second.
  • Win32_ProcessTrace - I started out with this, but alas, they do not contain full image name information, so I needed to query the OS for further information, and again, short-lived processes result in information loss.
  • Monitoring event logs - Event ID 4688 provides image names, but advanced configuration is required to obtain full command lines. Alternatively, SysInternals' Sysmon logs this information by default. WMI or other methods could be used to notify on event creation.
  • The Windows kernel exports PsSetCreateProcessNotifyRoutineEx, which provides access to a convenient PS_CREATE_INFO structure containing the full image name and command line. Alas, this requires either purchasing and protecting an expensive driver signing certificate, or leaving a kernel code execution vulnerability unpatched so as to inject a driver as described in the whitepaper I published in February.

Implementation

Unfortunately, mucking with drivers is not lazy enough for me. Since short-lived processes are important (they are commonly used as part of post-exploitation / recon), a Win32_Process instance creation query won't work. For ease of use, I've created a first draft solution by Frankensteining two C# StackOverflow answers together to use systray balloon notifications with WMI's Win32_ProcessTrace. I put this on the Internet so I could compile it and use it to see what was going on with my work computer.

Here's the gist of it

It's lazy, but for casual/opportunistic research, it's enough to play jazz. It doesn't capture command-line arguments and doesn't always capture the full image name, because it just uses Win32_ProcessTrace and then the .NET System.Diagnostics classes to get process information after the fact.

Alas, it bothers me not to have full image names or command-line arguments. The best source of information I know of in userspace is event logs, but I had trouble getting the info I needed on advanced logging configuration for my Windows 8.1 box, I just installed Sysmon. Now what?

Another gist

As it turns out, it is necessary to modify the registry and restart the Windows Management Instrumentation service (and its dependent services) to make this work. I added a Microsoft-Windows-Sysmon/Operational key to HKLM\SYSTEM\CurrentControlSet\Services\EventLog and restarted the winmgmt service, and it all came together.

This gist has a detailed console view along with the systray notification to prevent me from having to necessarily open eventvwr to see more details. Here's how it looks:


Observations

Here are a few startling events and associated discoveries sure to send a chill down your spine, all from tracking down process activity during my journey:
  • netsh.exe just ran. Is this some post-exploitation alteration of my firewall rules? No, a certain VPN client executes netsh.exe to get its work done. This was not the only software I caught doing that.
  • Windows Remote Assistance COM Server (raserver.exe) executed and terminated immediately. What interfaces does this provide? Could this be post-exploitation enabling of remote assistance for future access? No. It's a scheduled task that triggers upon group policy updates so remote assistance knows to update its configuration.
  • reg.exe just got run by cmd.exe. Holy schnikes, now I'm truly pwned. Is the parent process a backdoor executing persistence or other post-exploitation commands? Nope. It's just some endpoint management software that IT confirms they deploy and manage.
  • Added 9/7/16: Heart rate increases as I read C:\Windows\system32\rundll32.exe C:\Windows\system32\inetcpl.cpl,ClearMyTracksByProcess Flags:525568 WinX:0 WinY:0 IEFrame:0000000000000000. Then I remember I just closed an IE in-private window. Take a look at the parent process command line and see: "C:\Program Files\Internet Explorer\IEXPLORE.EXE" -private. WHEW!

Value

So, as you can see, sometimes situational awareness is not all it's cracked up to be! As most DFIR people and hunters are aware, there is plenty of noise just sitting there waiting to alarm you.

Even so, I think this tool could be useful for noticing anomalous process observables such as:

This tool can increase your awareness of what applications are responsible for certain behaviors, such as the Get Windows 10 user prompts that everybody loved so much. It can also raise your awareness of cases where security policies do not appear to be doing their job, such as application whitelisting. If you're a paranoid or curious power user, this may all be useful to you. In case it is, here are those gists again:
If I polish this up into something nicer, I'll try to update this article with the link.

Wednesday, March 30, 2016

TIL: Accessing memory in another process under Linux

Today it was hit home for me that I am now a "Windows guy", because I couldn't remember the name for the select or epoll syscalls, only muttering "WaitForMultipleObjects?" and scratching my head. This was hit further home because I couldn't think of anything other than ptrace for accessing another process's data. Granted, my friend says I've always been a Windows guy and I should get over it. But I really only started learning about how computers work when I began working with Linux, so this bothered me. Hence, I took a little walk down syscalls.h in 3.7.1 to see what would jog my memory or what new things I would find. Indeed, I did find something interesting and relevant.

include/linux/syscalls.h:
856 asmlinkage long sys_process_vm_readv(pid_t pid,
857                      const struct iovec __user *lvec,
858                      unsigned long liovcnt,
859                      const struct iovec __user *rvec,
860                      unsigned long riovcnt,
861                      unsigned long flags);
862 asmlinkage long sys_process_vm_writev(pid_t pid,
863                       const struct iovec __user *lvec,
864                       unsigned long liovcnt,
865                       const struct iovec __user *rvec,
866                       unsigned long riovcnt,
867                       unsigned long flags);

And here is a bookmark to the relevant file in LXR.

It's been a long time since I hacked on Linux, but I wonder what other interesting things have been added since I went over to the dark side (or came back to it, depending upon how you look at it).

Thursday, March 24, 2016

Beasting it

Wherein, I share brute force tools based on treating strings like numbers.

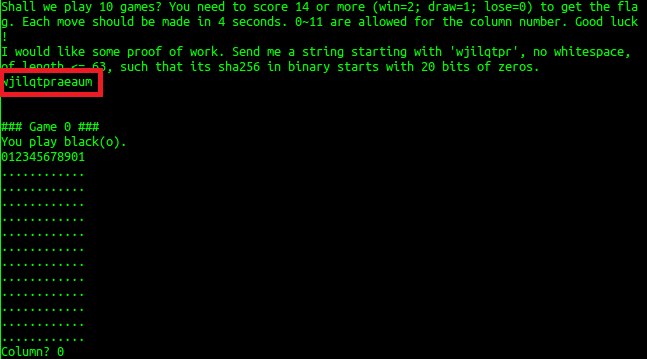
Working in offensive security has opened my mind to the fact that hacks don't have to be beautiful. So in working a couple CTFs recently, brute force has readily come to mind for me (as you can see from other articles on my blog). This recently happened again, when I had an opportunity to run a brute force over the network (yes, very slow, but it was a small character set, so why not) in tandem with working out the real solution, as well as in BCTF 2016 where we were asked to calculate a string whose SHA-256 hash begins with 20 cleared bits.

Sure, what the hay

I wrote a tool in Python, and another in C++, to treat strings as numbers of radix equal to the number of characters in the set of valid characters for the problem. By incrementing each "digit" of the string, and rolling over to the next when necessary, an incrementable string class iterates through all possible values for strings of that length and character set. Both tools use this to brute force a solution using strings of increasing length until either the solution is found or the sequence terminates.

It seems that these sorts of things arise semi-frequently in CTFs, so I generalized these into a single-source-file "framework", polished them up a little bit, and am sharing them below.

As an example, here is the amount of C++ code I would have needed to write using <openssl/sha.h> and linking with -lcrypto to brute force the hash in the BetaFour challenge using this framework. It includes an evaluator callback (try_a_value) that determines whether the current brute force buffer value satisfies the problem, and two supporting functions to hash the value and to determine whether the hash begins with 20 bits of zeroes (it assumes little-endian).

bool
try_a_value(unsigned char *val)
{
    unsigned char md[SHA256_DIGEST_LENGTH];

    PDEBUG("Trying %s\n", val);
    hash(val, md);
    return first20bits0(md);
}

bool
first20bits0(unsigned char *md) { return !(*((uint32_t *)md) & 0x00f0ffff); }

/* Calculate SHA-256 digest of string */
void
hash(unsigned char *startingwith, unsigned char *md) {
    SHA256_CTX ctx;
    unsigned char *data = startingwith;
    int len = strlen((const char *)startingwith);

    SHA256_Init(&ctx);
    SHA256_Update(&ctx, data, len);
    SHA256_Final(md, &ctx);
}

Only 24 lines including whitespace and comments. This will make it easier to for me to work on such challenges in the future, so in the spirit of openness and nerdy hackery, I thought I would share it.

Brutiful C++ and Python brute force tools for Windows and Linux:

Friday, March 18, 2016

CPUID, SMSW, and Other Delights

I wrote a quick and dirty utility to collect info a la redpill, nopill (props to Danny Quist but I can't find that whitepaper anymore!), etc. Nothing really novel about it, but I thought others may find it useful for researchy scenarios. I used it to investigate a hypervisor running on an Intel microprocessor, so each output line includes an indication of whether VMX appears to be supported. My intent was to train a Bayes learner to identify systems that are lying about whether they support VMX (thus likely detecting a hypervisor), similar to a previous project of mine, except in the course of this project, that became so very unnecessary.

Here is a snippet of its output:

So hex. Much flashy.
This tool works by creating and affinitizing a thread to each logical CPU in the system, executing a few compiler intrinsics and assembly functions, and outputting the desired information for each CPU. Like most research code I post, this tool is only as complete as I needed it to be for my own purposes. Therefore, it does not support 32-bit platforms, does not collect the value of the SLDT instruction from each processor, and is not meant for AMD microprocessors. If you can tolerate all that, then the source code is here:


For more information about CPUID and using microprocessor instructions, I thought the book Professional Assembly Language Programming was very helpful, and of course, the Intel 64 and IA-32 microprocessor manuals are the authoritative reference on all things Intel x86 and x64.

Wednesday, March 9, 2016

Extreme Rubber Ducking

"And now for something... completely different."

In 2013, I started to think about how I could barely remember calculus. This made me a sad panda, so I started reviewing undergraduate math and then whipped out my electrical engineering textbooks (yes, I kept those). That gave way to a comprehensive review of my undergraduate that is still in progress.

In pounding through old textbooks without any teachers or tutors, I've learned that preparing to ask for help is actually a great way to solve problems independently. It forces me to walk through my case like a lawyer and rigorously present my assertions so any contradictions are laid bare. I find it most effective when I write it down and commit to posting it on a forum or asking a friend if I don't manage to figure it out by myself. This is like a slightly more stringent form of Rubber Duck Debugging.

https://upload.wikimedia.org/wikipedia/commons/8/8e/Rubber_duckies_So_many_ducks.jpg
I like to use several ducks at once. It's much more powerful that way.
Here, I share two examples of this in a context that is unusual to my blog: circuit analysis. In the first scenario, I was wrong, and in the second, it was the book's fault. Thanks, book! Great job!

Currently Going Nowhere

I first got stuck on a problem that entailed analyzing multiple circuit nodes as a single "supernode". The book did not work an example with three nodes and a dependent source, so I worked the problem repeatedly, getting the same wrong answer each time. After looking at the math over half a dozen times, I concluded that I was misunderstanding how to apply the new concept in this special case (three nodes, dependent source). I tried reading several articles about supernodes and it seemed like I was doing this correctly. I finally gave in and prepared to phone a friend.

For depicting this circuit, I found a pretty cool tool provided by DigiKey called SchemeIt. I threw together this schematic:

In the words of my EE professor: Very simple.
Then I began mounting my case. I started with describing the currents that enter and exit the supernode (nodes 1, 2, and 3). My discussion didn't get very far:
Apply Kirchoff's Current Law to the supernode:
First, I define $i_1$ to be the same as $i$, $i_2$ to be the current from node 2 down to the reference node (through the 4-ohm resistor), $i_3$ to be the current from node 3 down to the reference node (through the 3-ohm resistor), and $i_4$ to be the current flowing from node 1 through the 6-ohm resistor to node 3. Hence,
$i_4 = i_1 + i_2 + i_3$
Wait.
Wait, wait, wait.
This is a flawed equation. It doesn't take into account the fact that $i_4$ both leaves AND enters the supernode.
So, as far as the supernode was concerned, the current $i_4$ was going... Nowhere. It was both exiting and entering the node, so from the perspective of the supernode, $i_4$ cancelled itself out. I realized this because I took the time to carefully make my case and then the contradiction stood right out: "$i_4$ [is] the current flowing from node 1 through the 6-ohm resistor to node 3" (both part of the same supernode). Onward!

This Practice Problem is Not Operational

I later ran into an issue applying the circuit equivalent model of an operational amplifier (an op-amp). I ran through the same process. First, I drew my rendition of the original schematic and my equivalent model. I transformed the circuit using the "non-ideal" model wherein the op-amp's inverting and non-inverting terminals are connected through an input resistance, and the op-amp's output terminal is modeled as a voltage-controlled voltage source in series with a small output resistance.

Equivalent. See? Very simple.


The exercise was to find (a) the closed-loop gain $v_o/v_s$, and (b) the output current $i_o$ when $v_s = 1 V$. I went to work explaining myself, walking through the application of Ohm's law to define current-voltage relationships, Kirchoff's Voltage Law, mesh analysis, etc., until I arrived at a system of equations. I punched it all into GNU Octave and got those same old familiar answers:

Matlab, eat yer heart out!
From the 3x1 matrix above, I concluded $i_3 = -6.5 \times 10^{-4} A$, or -650 uA. Substituting some more equations, I got:
$i_o = - (-650 uA) = +650 uA$
However, the book's answer was that $i_o = -362 mA$.

For the life of me, I couldn't find my error by talking it through. Before submitting the question to a friend or a forum, I thought I would work a few more examples and then revisit this one. I turned the page and worked the next example, which turned out to be a re-working of the same problem. The end of that example reads:
"This, again, is close to the value of 0.649 mA [aka 649uA] obtained in Practice Prob. 5.1 with the nonideal model."
Wait... That's... Not what the book said on the previous page! But that is what I got, every time I worked that problem! I'd been working this problem over and over, and it was a MISPRINT. ARRRRRRGH!!

Lessons Learned

I learned two things from these exercises:
  1. You can become more self-reliant in solving problems if you discipline yourself to write up the details like you're truly about to defend your thought process to someone else; and,
  2. You're not always wrong ;-)
The glory of this process is that often I can use it to ferret out my own stupid mistakes without ever having to share them with anyone (unless I decide to write a ducking blog article about it).

The experience I got from this also ties in closely with my professional observation that having to write about one's work forces the author to explain why the work is correct, which tends to yield ideas about how that work could have been done better. Which is to say, whether you're working out issues or you already think you're all the way there, reporting on your work will invariably improve the outcome.

You can celebrate by taking your ducky for a bubble bath!

In addition to the moral of the story, I also wanted to point out the following:
  1. GNU Octave is super useful
  2. SchemeIt ain't too terrible, either
So there.